Log-Scale IQR-Based Outlier Detection
Summary:
We use validated rates
to estimate outlier boundaries using the IQR method on the log scale, then use these boundaries on non-validated rates to flag outliers.We define outlier boundaries in the following way:
where is a truncated IQR and is the number of validated rates for a billing code, .
Validated rates are always included. Non-validated rates falling outside of the boundaries are considered outliers and excluded.
Methodology
Background:
Traditional IQR-based outlier detection calculates the Interquartile Range (), where Q3 is the 75th percentile and Q1 is the 25th percentile. Then, data are considered to be outliers if greater than or less than .
This IQR-based method faces challenges with negotiated rates, because negotiated rates often follow a right-skewed distribution with a long tail, dense central mass, and are bounded below by 0. Using the traditional IQR-based approach would flag too many outliers due to a thin IQR. Further, the traditional approach often yields negative outlier thresholds (e.g. ), which fails to capture any outliers on the low end.
Solution:
A common solution is to apply a log transformation to reduce the right-skew, making the data more closely resemble a normal distribution.
Log Transform the Data:
Compute the interquartile range:
Identify Outliers:
A rate in log-transformed space is considered an outlier if:
We'll evaluate
See SQL
CREATE TABLE hive.cld_utils.outlier_bounds_2025_03_13 AS
WITH
log_transformed AS (
    SELECT
        billing_code_type,
        billing_code,
        COALESCE(CAST(asp.payment_limit AS DOUBLE), medicare_rate) as medicare_rate,
        ln(canonical_rate) as log_canonical_rate
    FROM hive.cld_v0_1.prod_combined_all c
    LEFT JOIN hive.plancheck_hospital_rates.asp_standardized_2025_01 asp
        ON c.billing_code = asp.code
    WHERE
    canonical_rate_score = 13
    AND canonical_rate > 0.1
    AND
    (
        (
            substring(billing_code, 1, 1) IN ('J','Q')
            AND
            canonical_rate_type like '%drug_dosage_std%'
        )
        OR
        substring(billing_code, 1, 1) NOT IN ('J','Q')
    )
),
iqr AS (
    SELECT
        billing_code_type,
        billing_code,
        AVG(medicare_rate) as avg_medicare_rate,
        APPROX_PERCENTILE(log_canonical_rate, 0.25) as q1,
        APPROX_PERCENTILE(log_canonical_rate, 0.75) as q3,
        CAST(
            APPROX_PERCENTILE(log_canonical_rate, 0.75)
            - APPROX_PERCENTILE(log_canonical_rate, 0.25)
            AS DECIMAL(8,5)
        ) as iqr,
        count(*) as n
    FROM log_transformed
    GROUP BY 1,2
),
iqr_truncated AS (
    SELECT
        *,
        CASE
            WHEN iqr > 1 THEN 1
            ELSE iqr
        END as iqr_truncated
    FROM iqr
)
SELECT
    billing_code_type,
    billing_code,
    avg_medicare_rate,
    q1,
    q3,
    iqr,
    iqr_truncated,
    CASE
        WHEN n < 40
            THEN avg_medicare_rate * 0.1
        ELSE exp(q1 - 1.5 * iqr_truncated)
    END as lower_bound,
    CASE
        WHEN n < 40
            THEN avg_medicare_rate * 10
        ELSE exp(q3 + 1.5 * iqr_truncated)
    END as upper_bound,
    n
FROM iqr_truncated
WHERE
(
    avg_medicare_rate IS NOT NULL
    OR
    n > 40
)
Plot Example
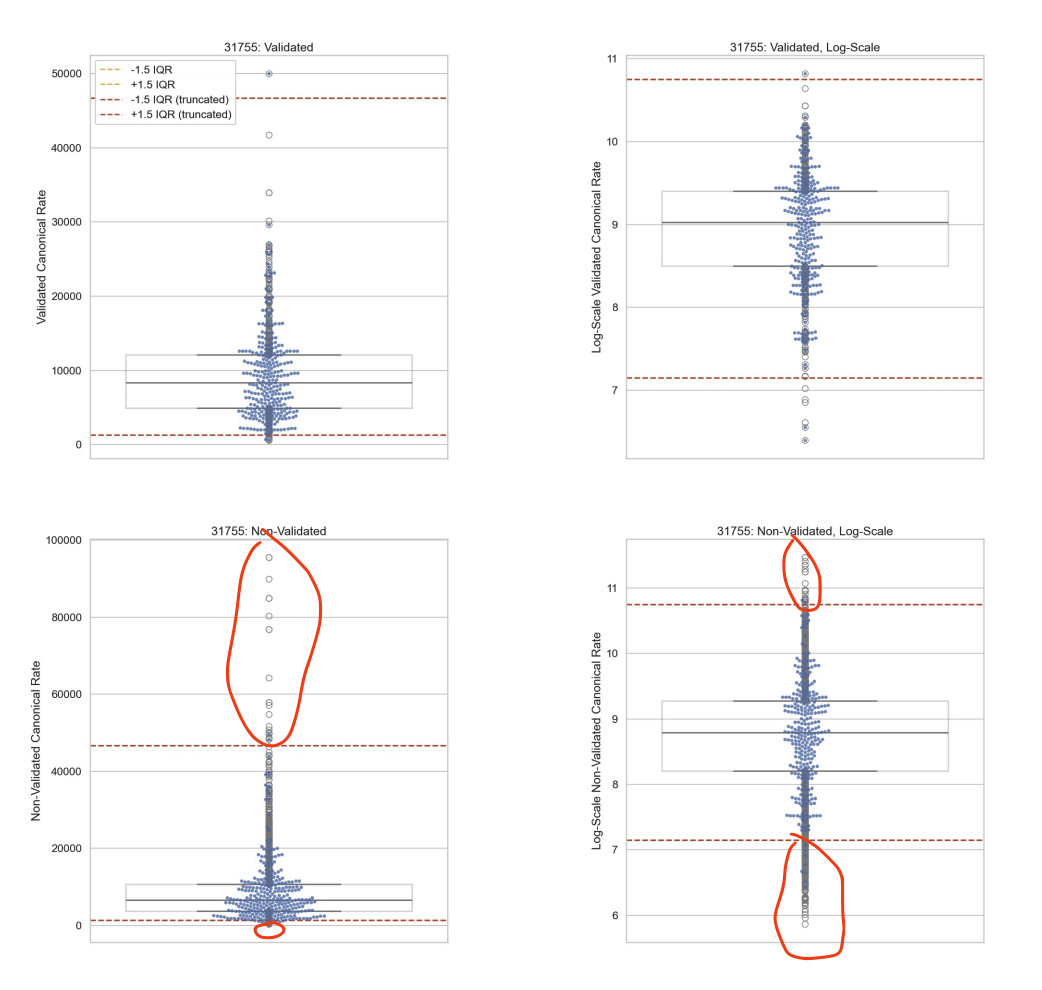
In the plots below, we show the distribution of validated rates for CPT code 31755 in the top row and non-validated rates for CPT code 31755 in the bottom row. The left column shows the distributions on the linear scale, whereas the right column shows the distributions on the logarithmic scale.
In all four plots, the horizontal dotted lines indicate outlier thresholds, computed using validated rates, on the log scale (e.g. ). For the plots on the left column, these log scale thresholds are converted back to the linear scale (e.g. )
31755
Exceptions
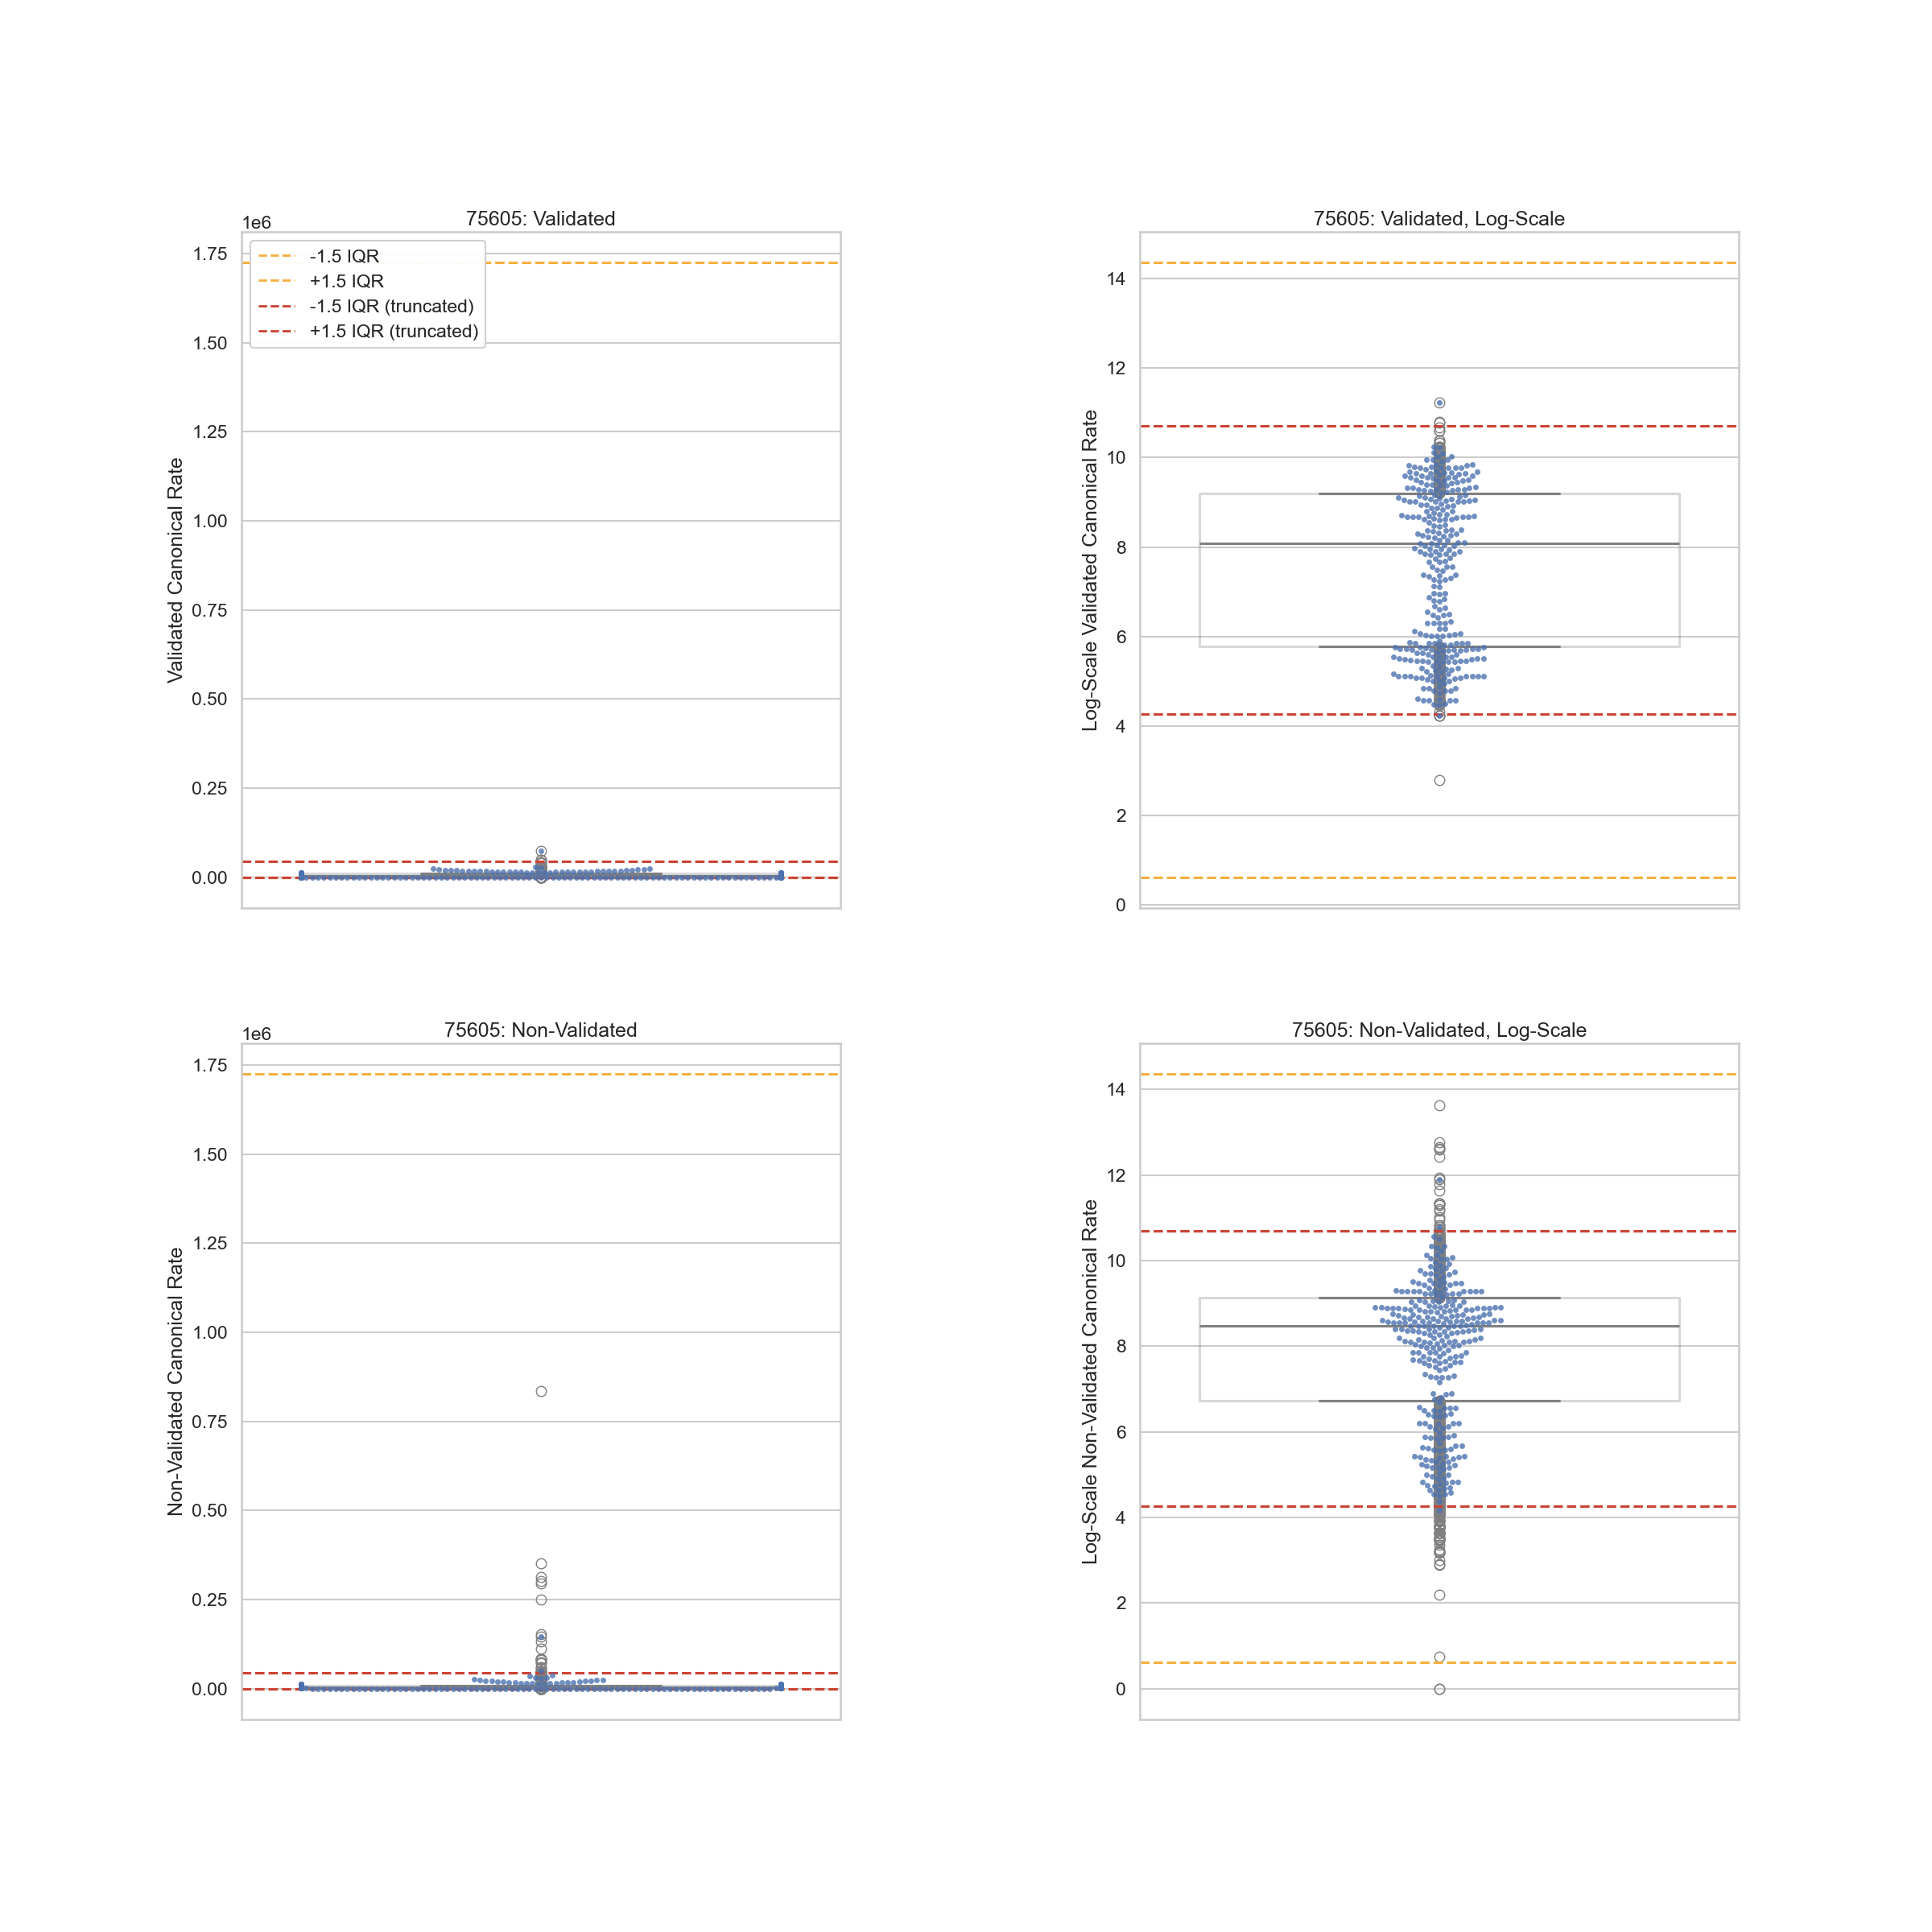
Exception 1: Truncating IQR
Sometimes, the spread of validated rates can be too wide. Consider code 75605 where
validated rates may be as high as $60k and as low as $55. The IQR is 3.42 and q3
is 9.21, then $1,689,595. To prevent such an extreme
upper bound, we truncate the IQR to 1.
This is an aggressive edit but only affects where the rate variability is unbelievably high.
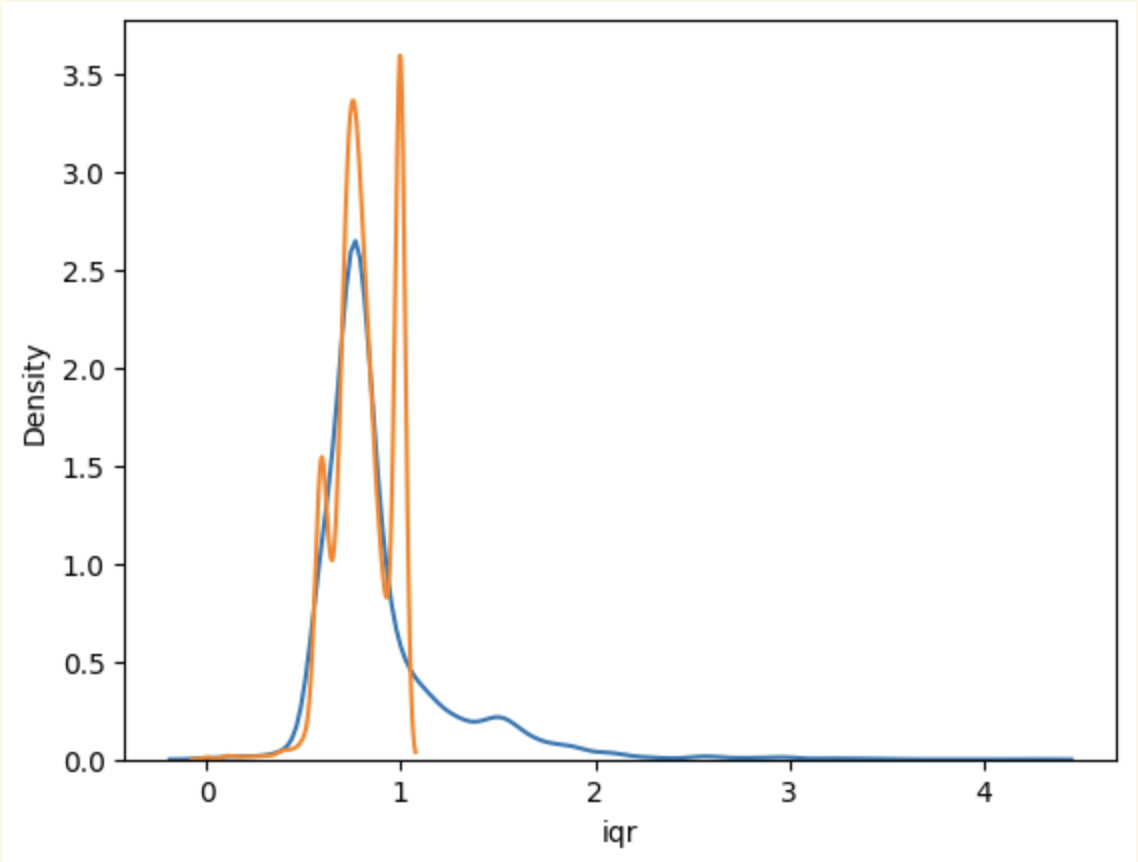
Here is a demonstration of truncation:
Here is the distribution of IQRs (blue = untruncated, orange = truncated):
Exception 2: Low Ns
If there are not enough validated rates for a given code, we cannot reliably estimate outlier bounds using this methodology. In this case, defer to medicare based benchmarks (10% of medicare, 1000% of medicare).