PG Graph
Quickstart
- Explore the graph database here:
- Output Tables are here:
tq_dev.internal_dev_csong_sandbox.prod_pac_connections- each row is a PG, columns contain TINs, HCOs, and HCPs
tq_dev.internal_dev_csong_sandbox.prod_hs_pac_links- each row is a HS; columns contain PGs and intermediary HCOs/TINs
tq_dev.internal_dev_csong_sandbox.prod_hcp_best_links- each row is a Physician, columns contain primary HCO and primary PG
current outputs use thresholds:
thresholds = {
    'jaccard': 0.3,
    'min_containment': 0.5,
    'intersection_count': 50,
}
Goals:
Primary goals are:
- add more physician groups to Clear Rates
- set up scalable methodology to add hospital unaffiliated physician groups
- support Network Check, which frequently needs to "reprice" individual physician claims
To do this, we need:
- Create a table of Physician Groups with:
- a name
- a list of TINs
- a list of NPIs
- Create a table of Health System + State pairs with:
- a list of affiliated physician groups
- Create a table of individual physicians with:
- primary HCO
- primary physician group
#1 and #2 are required for Clear Rates. #3 provides a bridge that Network Check can use (i.e. given individual physician, which group's rates should it search?)
Background: What is PECOS?
When an individual physician joins a physician group, they submit a form to CMS letting them know which organization to submit payment. So instead of sending payment to the individual, the payment is "reassigned" to the physician group.
PECOS maintains a public reassignments database, which we can use to identify individual physician and physician group relationships.
A PAC ID represents a physician group.
Inclusion Criteria: What Data are we Using?
- PECOS
- All PAC ID with total reassignments > 5
- https://github.com/turquoisehealth/providers-graph-db/blob/main/scripts/physician_groups/chansoo_logic/1%20physician_groups.sql
- Payer Data: NPI-TIN pairings
- Only store if NPI appears in PECOS data as an individual physician
- At least 4 payers have posted the TIN-NPI pair
- Komodo Data: HCO-HCP pairings
- Only store if HCP appears in PECOS data as an individual physician
- All claims after 2023-01-01
- Store # of encounters for each pair
- Hospital Data: Health System - HCO pairings
Data Loading Queries:
Why a Graph Database?
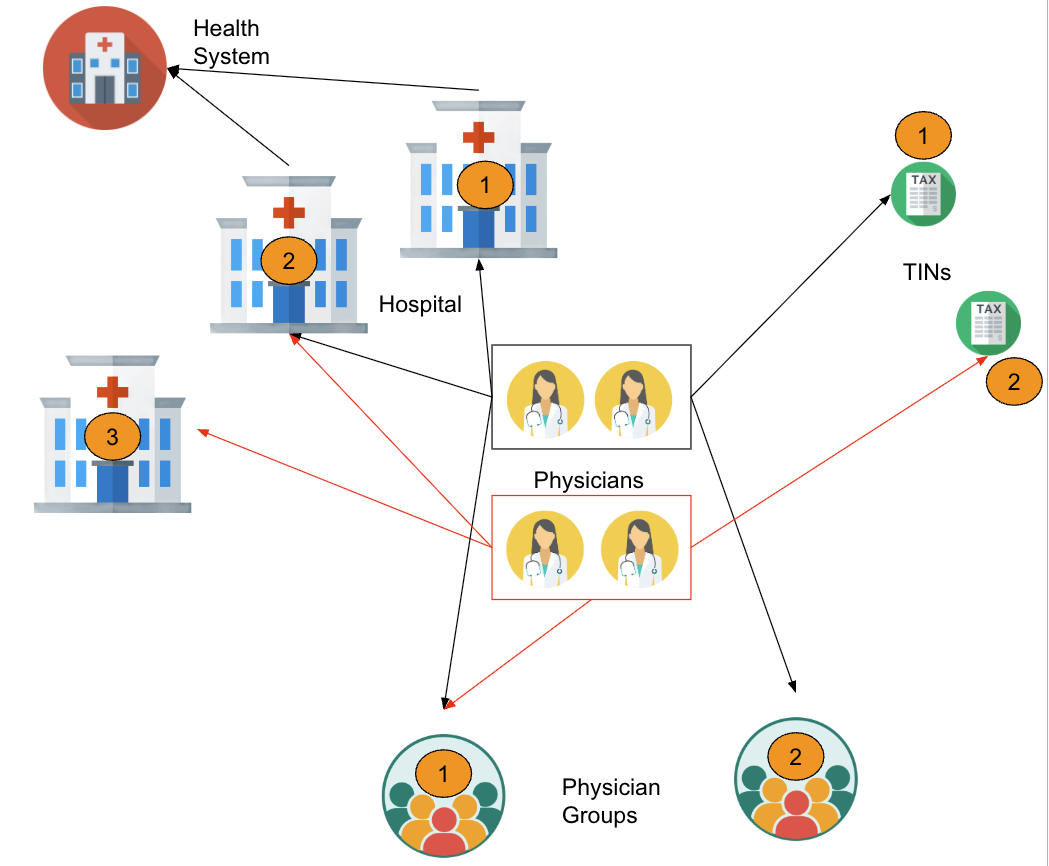
Below is a simplified example of the complicated data relationships we are working with.
- The top two physicians in the black box:
- are affiliated hospital 1 and hospital 2, based on claims
- are affiliated with TIN 1 based on MRF data
- are affiliated with PAC 1 AND PAC 2 based on PECOS data
- The bottom two physicians in the red box:
- are affiliated with hospital 2 and hospital 3, based on claims
- are affiliated with TIN 2 based on MRF data
- are affiliated with PAC 2 based on PECOS
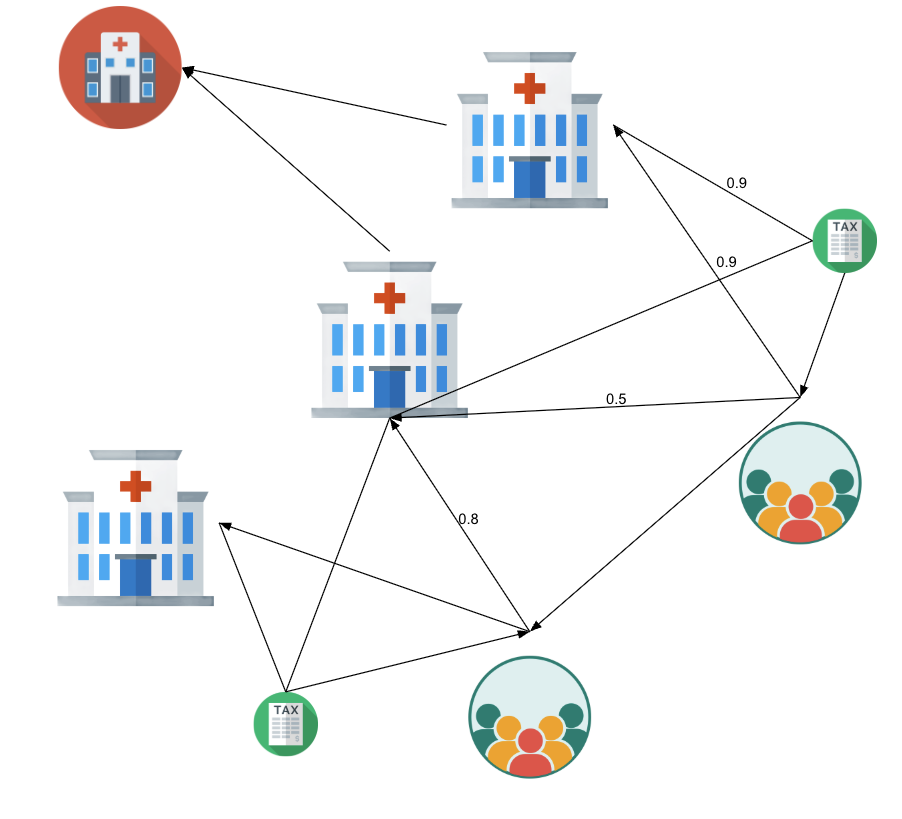
Then, we can construct edges that compare organizations' similarities based on physician affiliations:
How would we use this to accomplish our goals?
- For each Health System, we can look for Physician Groups that are N degrees away, e.g.:
- [Health System] -> [Hospital] -> Physician Group
- [Health System] -> [Hospital] -> [TIN] -> Physician Group
- For each physician, we can look for the primary HCO (e.g. most encounters) then the physician group that is most closely associated with that HCO
Methodology
Load Graph Database
Nodes
- PAC (Physician Groups) (
pac) - Individual physicians (
hcp) - Healthcare organizations (
hco) - Tax IDs (
tin) - Health systems (
hs)
Raw Data Edges
- PAC ↔ HCP
- HCO ↔ HCP
- number of encounters
- TIN ↔ HCP
- Health system ↔ HCO
Inferred Edges
- PAC ↔ HCO
- TIN ↔ HCO
- PAC ↔ TIN
We infer these organization-similarity edges by comparing their arrays of affiliated NPIS.
For each pair of organizations (PAC, HCO, TIN), we compute similarity measures over their sets of affiliated NPIs. Specifically:
- Jaccard Similarity: Measures the proportion of shared NPIs relative to the union of their NPIs.
Example:
If PAC A has NPIs {1, 2, 3, 4} and HCO B has {3, 4, 5, 6}, then:
- Containment Measures: Fraction of shared NPIs relative to each entity's total NPIs.
Example:
- Maximum Containment: The maximum of the two containment scores.
- Intersection Counts: The raw count of shared NPIs.
We apply thresholds on these measures (e.g., minimum Jaccard or minimum containment) to retain only meaningful similarity edges.