Tuning
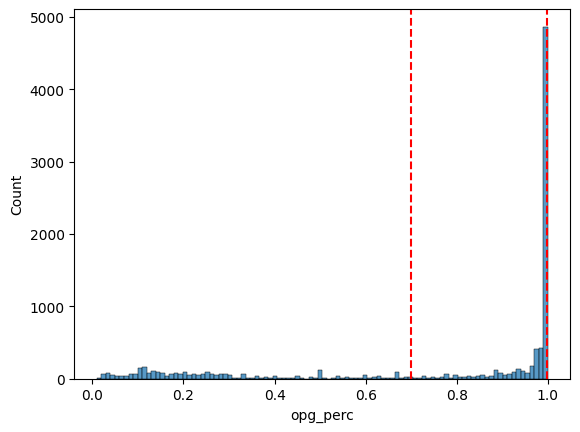
Outpatient Procedure Grouper (OPG) Tier
To determine whether to use an inferred OPG rate, we calculate the percentage of codes that share the same inferred rate out of all codes with any reported rate. If this percentage exceeds 70%, the inferred rate is applied.
The plot below shows the distribution of percentages based on a sample of 1000 payer-network-provider-opg.
This imputation tier is applied for the payer-network-provider-opg combinations between the two red dotted lines.
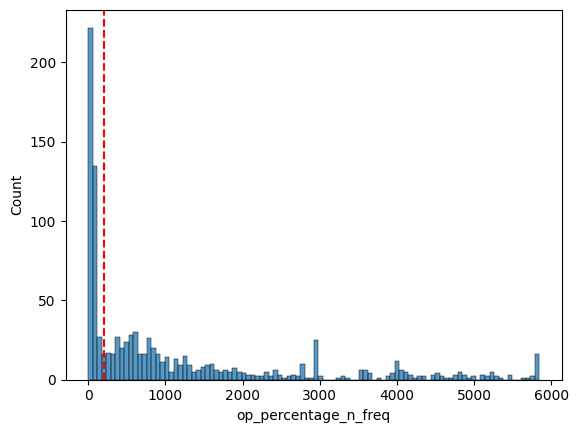
Outpatient Global Percentage
If (1) there is a single percentage rate reported for over 200 HCPCS codes and (2) this rate covers > 90% of all rates reported for the payer-network-provider, we infer that this percentage rate represents an OP global percentage rate.
In the plot below, each unit is a payer-network-provider and the plot shows the distribution of the number of codes sharing a single percentage rate (1000 samples).
As an example, the rightmost bar shows that there are ~20 payer-network-providers that reported ~5800 HCPCS codes with an identical percentage rate. The red dotted line reflects the 200-code threshold.
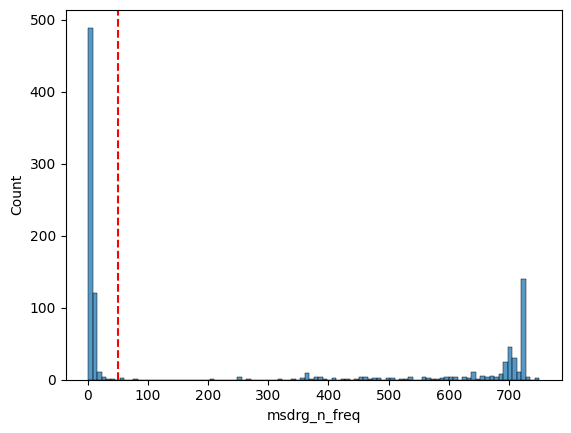
MS-DRG Global Base Rate
First, compute a candidate base rate by dividing all inpatient rates by the CMS MS-DRG weight. If (1) there is a single base rate reported for over 50 MS-DRG codes and (2) this rate covers > 90% of all rates reported for the payer-network-provider, we infer that this rate represents an IP global base rate.
In the plot below, each unit is a payer-network-provider and the plot shows the distribution of the number of codes sharing a single base rate (1000 samples).
Unfortunately, the tallest bar to the left shows that most payer-network-providers are reporting ~0 MS-DRG codes, and we are not able to infer a base rate for these payer-network-providers.
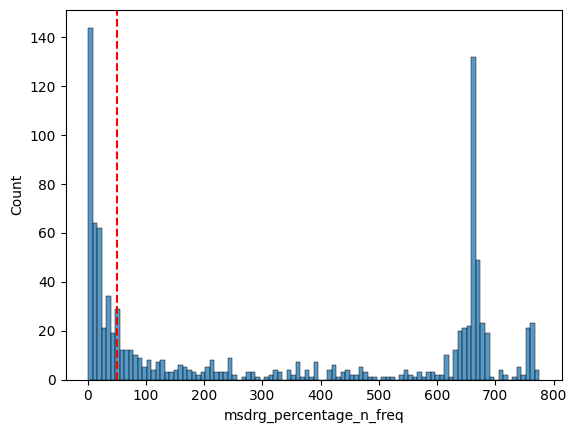
MS-DRG Global Percentage Base Rate
If (1) there is a single percentage rate reported for over 50 MS-DRG codes and (2) this rate covers > 90% of all rates reported for the payer-network-provider, we infer that this percentage rate represents an IP global percentage rate.
In the plot below, each unit is a payer-network-provider and the plot shows the distribution of the number of codes sharing a single percentage rate (1000 samples).