Scores
Table of Contents
- Hospital/ASC Accuracy Scores
- Drug Accuracy Scores
- Lab Accuracy Scores
- Physician Group Accuracy Scores
- How Ties are Broken
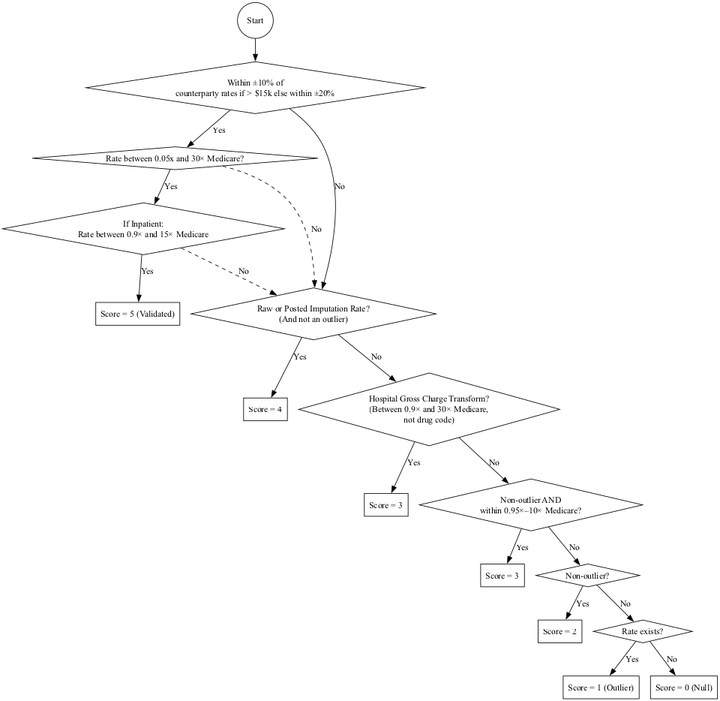
Hospital/ASC/Imaging Accuracy Scores
Each rate is assigned a 1-5 canonical_rate_score.
| Canonical Rate Score | Interpretation |
|---|---|
| 5 | Validated |
| 4 | Raw - Payer/Hospital Posted Dollar; Not Outlier |
| 3 | Transform/Impute - Medicare Benchmark Validated |
| 2 | Transform/Impute - Not Medicare Validated but not an outlier |
| 1 | Outlier |
| 0 | Rate Does Not Exist |
Validated: Within ±20% of counterparty rates (±10% if rate ≥ $15k) AND meets Medicare bounds.
Medicare Bounds:
- IP: between .9x and 10x
- OP/PRO: between .5x and 30x
Flow Chart
Code
from graphviz import Digraph

# Initialize directed graph
dot = Digraph(comment="Accuracy Score Flow (Gross Charge 0.9x–30x Medicare)", format="png")
dot.attr(rankdir="TB", size="10")

# Start
dot.node("A", "Start", shape="circle")

# ±20% check first
dot.node("D", "Within ±20% of\ncounterparty rates?", shape="diamond")
dot.edge("A", "D")

# Global Medicare bound <30x
dot.node("D2", "Rate < 30× Medicare?", shape="diamond")
dot.edge("D", "D2", label="Yes")

# Medicare bound checks after ±20%
dot.node("D3", "If Inpatient:\nRate between 0.9× and 30× Medicare", shape="diamond")
dot.edge("D2", "D3", label="Yes")

# Score 5 validated if holds
dot.node("S5v", "Score = 5 (Validated)", shape="box")
dot.edge("D3", "S5v", label="Yes")

# Fallthroughs if checks fail
dot.edge("D", "F", label="No")
dot.edge("D2", "F", label="No", style="dashed")
dot.edge("D3", "F", label="No", style="dashed")

# Raw/post imputation
dot.node("F", "Raw or Posted Imputation Rate?\n(And not an outlier)", shape="diamond")
dot.node("S4r", "Score = 4", shape="box")
dot.edge("F", "S4r", label="Yes")

# Gross charge transform (edited to 0.9x–30x Medicare)
dot.node("G", "Hospital Gross Charge Transform?\n(Between 0.9× and 30× Medicare,\nnot drug code)", shape="diamond")
dot.edge("F", "G", label="No")

dot.node("S3t", "Score = 3", shape="box")
dot.edge("G", "S3t", label="Yes")

# Medicare benchmark
dot.node("H", "Non-outlier AND\nwithin 0.95×–10× Medicare?", shape="diamond")
dot.edge("G", "H", label="No")

dot.node("S3b", "Score = 3", shape="box")
dot.edge("H", "S3b", label="Yes")

# Non-outlier generic
dot.node("I", "Non-outlier?", shape="diamond")
dot.edge("H", "I", label="No")

dot.node("S2n", "Score = 2", shape="box")
dot.edge("I", "S2n", label="Yes")

# Outlier case
dot.node("J", "Rate exists?", shape="diamond")
dot.edge("I", "J", label="No")

dot.node("S1o", "Score = 1 (Outlier)", shape="box")
dot.edge("J", "S1o", label="Yes")

# Score 0 (null)
dot.node("S0", "Score = 0 (Null)", shape="box")
dot.edge("J", "S0", label="No")

# Render PNG
output_path = "/mnt/data/accuracy_score_flow_grosscharge_0.9x_30x"
dot.render(output_path, format="png", cleanup=False)

output_path + ".png"
Drug Accuracy Scores
Drug rates use a specialized scoring methodology that differs from medical codes. Each rate is assigned a 1-5 canonical_rate_score.
| Canonical Rate Score | Interpretation |
|---|---|
| 5 | Validated |
| 4 | Ratio to Medicare/ASP between 1.25 and 3.5 (10th–90th percentiles) |
| 3 | Ratio to Medicare/ASP between 0.9 and 4 |
| 2 | Ratio to Medicare/ASP < 0.9 or > 4 |
| 1 | Outlier - Hospital MRF: < 0.8 or > 4; Payer MRF: < 0.8 or > 10 |
| 0 | Rate Does Not Exist |
Drug Validation Criteria
| Method | Criteria |
|---|---|
| ASP Validated | Within ±20% of counterparty rates (±10% if rate ≥ $15k) AND between 1.2x-4x Medicare/ASP |
| ASP Bounds - Hospital | Between 0.8x and 4x Medicare ASP rate |
| ASP Bounds - Payer | Between 0.8x and 10x Medicare ASP rate |
Lab Accuracy Scores
Lab rates use a consistency-based scoring methodology. "Consistent" is defined at the lab/payer-network level and indicates that the lab reports rates at a consistent percentage of Medicare rates. Specifically, we define consistency as having at least 30 reported rates AND having the difference between the 5th and 95th percentiles of % of Medicare rates be less than 0.25.
Each rate is assigned a 1-5 canonical_rate_score.
| Canonical Rate Score | Interpretation |
|---|---|
| 5 | Validated - Consistent rate within 0.4x-1.3x Medicare |
| 4 | Consistent rate within 0.3x-3x Medicare |
| 3 | Within 0.4x-1.3x Medicare (not marked as consistent) |
| 2 | Not validated but within bounds (0.2x-4.5x Medicare) |
| 1 | Outlier |
| 0 | Rate Does Not Exist |
Physician Group Accuracy Scores
Physician Group rates use a consistency-based scoring methodology. "Consistent" is defined at the PG/payer-network level and indicates that the PG reports rates at a consistent percentage of Medicare rates. Specifically, we define consistency as having at least 30 reported rates AND having the difference between the 5th and 95th percentiles of % of Medicare rates be less than 0.25.
Each rate is assigned a 1-5 canonical_rate_score.
| Canonical Rate Score | Interpretation |
|---|---|
| 5 | Validated (same logic as hospitals) or Consistent rate with ratio to Medicare between 0.9 and 3.5 (10th–90th percentiles) |
| 4 | Consistent rate with ratio to Medicare between 0.5 and 5.5 (1st–99th percentiles) |
| 3 | Ratio to Medicare between 0.9 and 3.5 (not marked as consistent) |
| 2 | Ratio to Medicare between 0.5 and 5.5 (not an outlier, captures ~98% of posted PG rates) |
| 1 | Outlier |
| 0 | Rate Does Not Exist |
Anesthesia Outlier Bounds
Anesthesia codes have their own outlier bounds:
- lower bound: 1x Medicare
- upper bound: $200
How Ties are Broken
Sometimes we have both payer and hospital rates and they both have a canonical rate score of 4. Which one do we pick? Ties are broken by selecting the higher-likelihood rate. The "likelihood" is a statistic computed using our expectations for that code based on validated rates (payer/hospital reported similar rates).
Where can I see this likelihood score? It's in the validation score's decimals.
As an example, if the validation score is 6.85, the likelihood of randomly drawing the rate from the expected distribution is 85%.
We estimate the likelihood as the integral of the probability distribution function of a between . (i.e. difference of CDF at these two points)
and come from the observed distribution of validated rates for that billing code and provider type. We log transform the validated rates to reduce skew. In general this observed distribution is normal-ish enough. But we do exclude distributions that are too skewed even after a log transform. We also exclude distributions that are clearly multi-modal.
For more details, see accuracy scores v2