OPPS Medicare Benchmarks
Summary
Is there a bias that arises when comparing commercial rates to OPPS medicare rates, because OPPS uses APC but private insurers do not? Does it matter?
Medicare relativity isn't a standardized metric and its distribution can vary a lot depending on the service.
Background
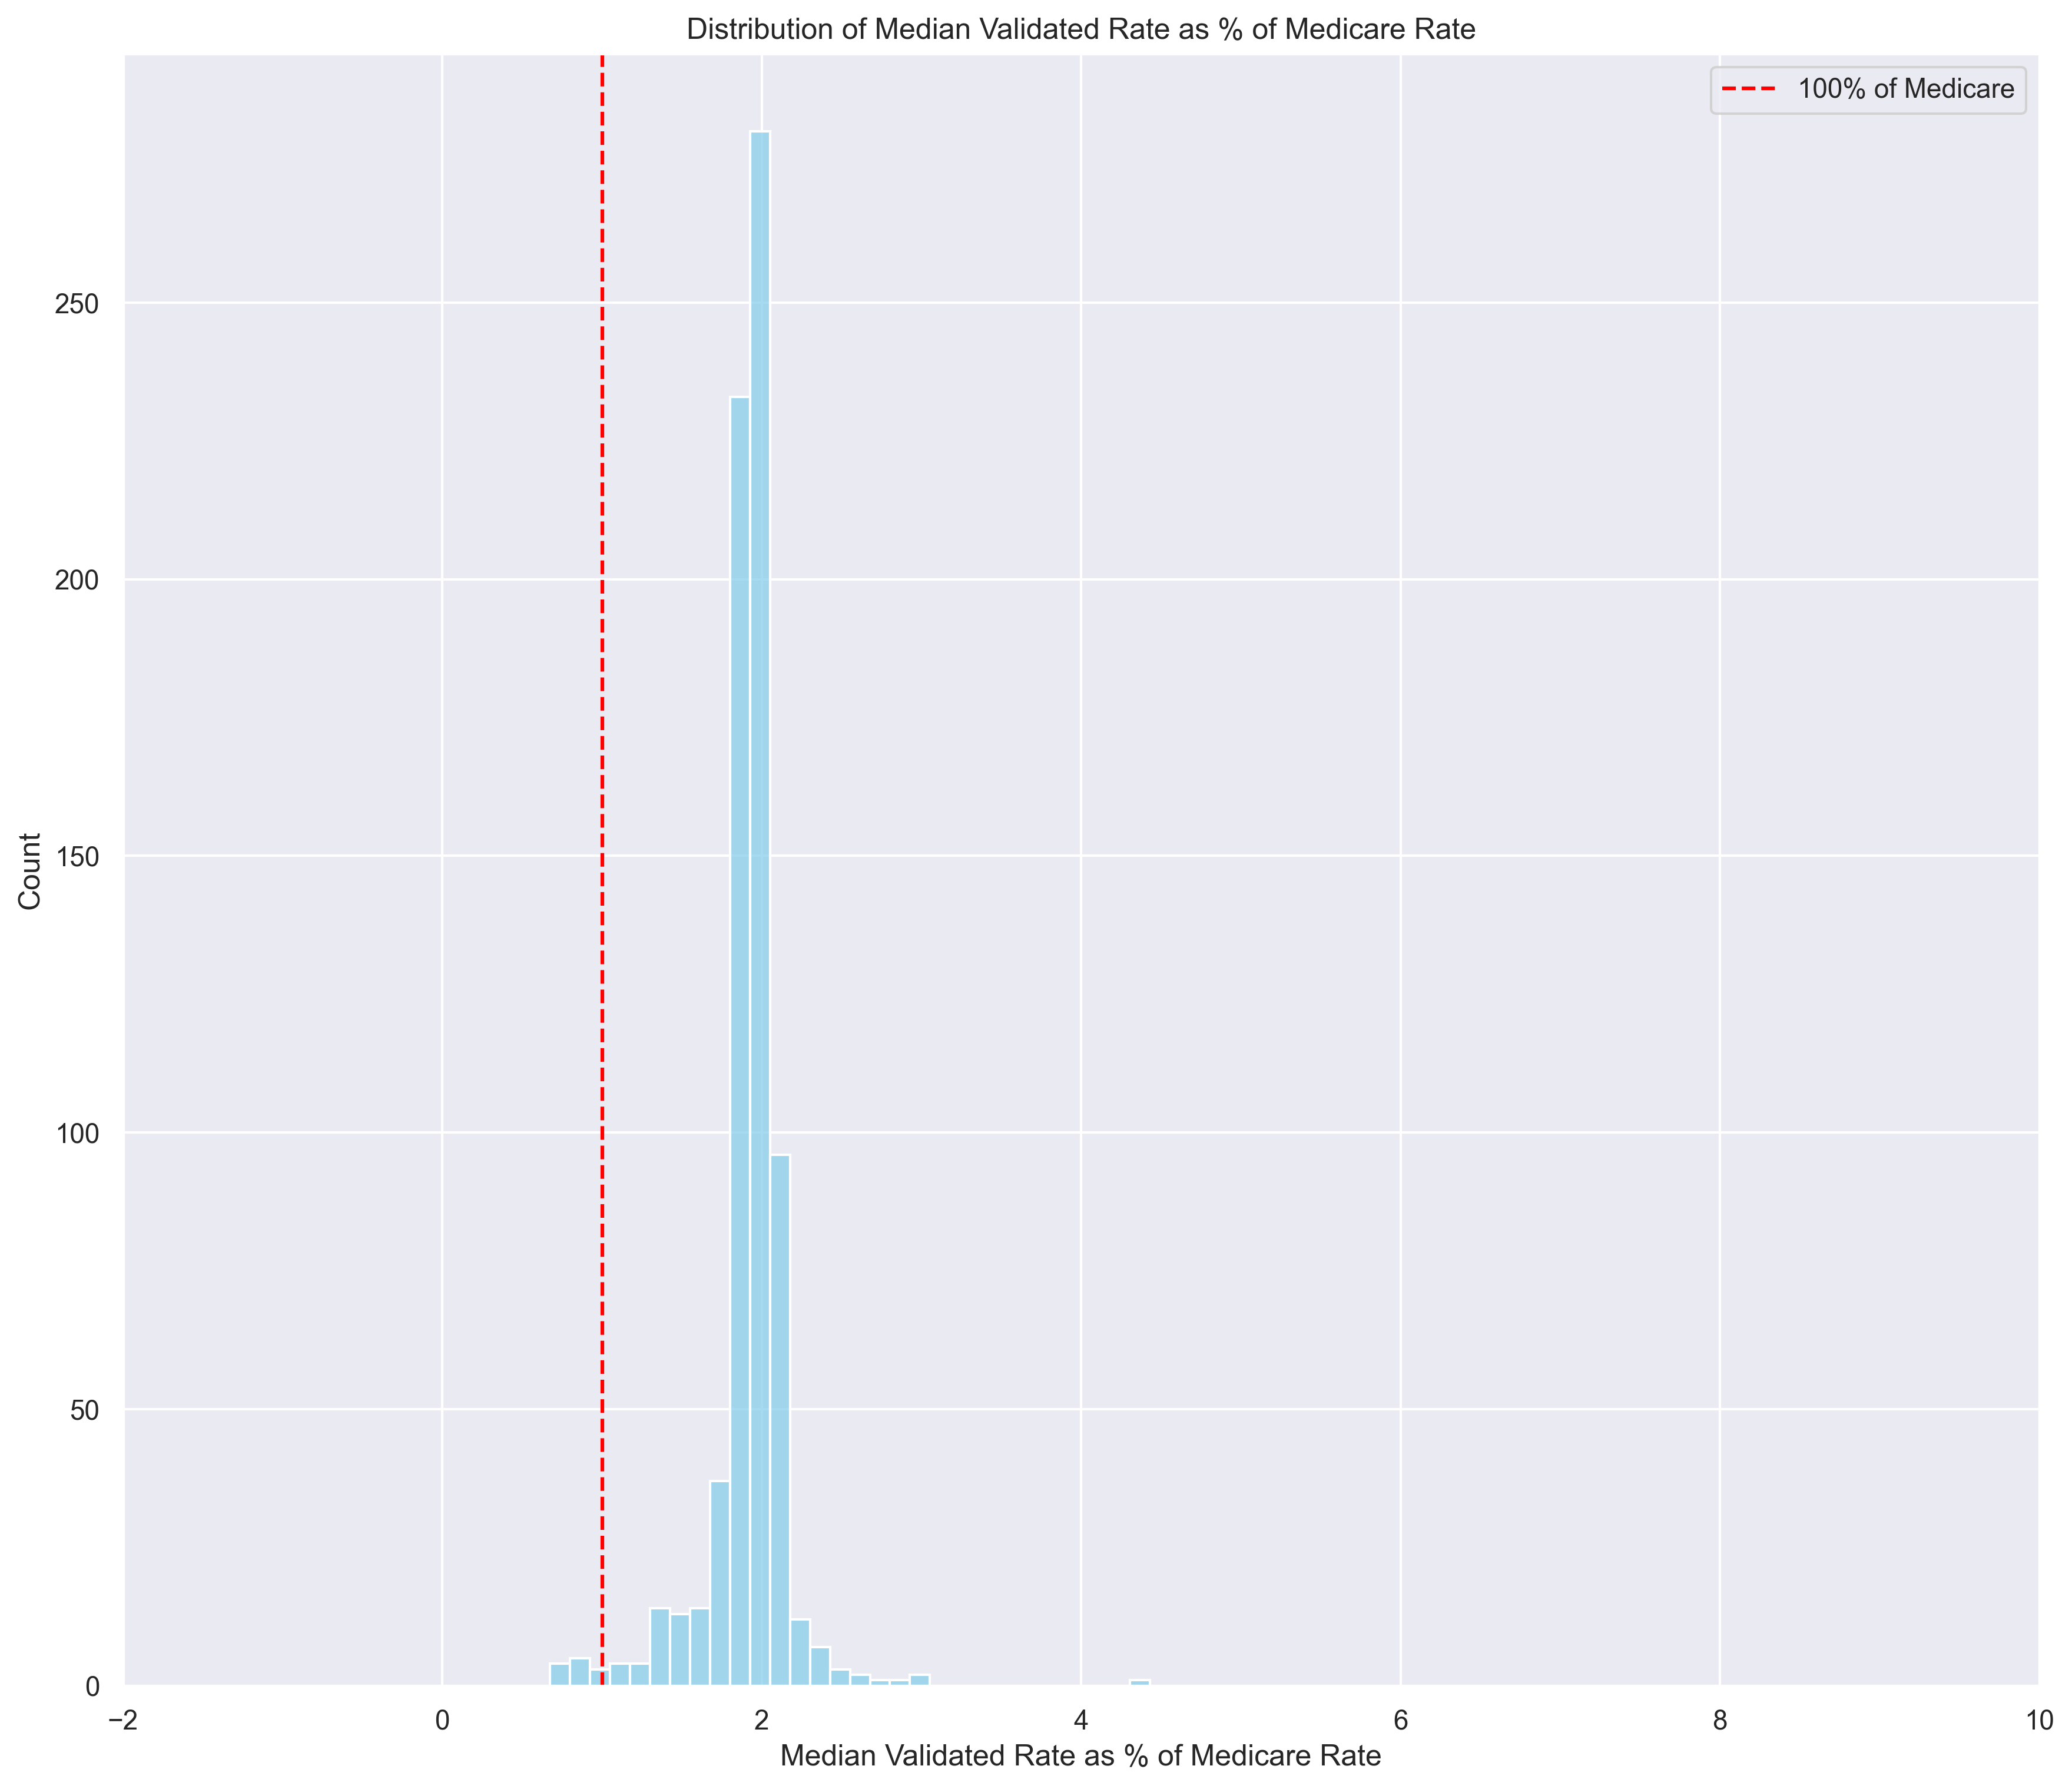
In the inpatient setting (MS-DRGs), nearly all codes have a median commercial-rate roughly 2x the medicare rate. Here's a plot showing the distribution of MSDRG median validated-rates as a % of medicare.
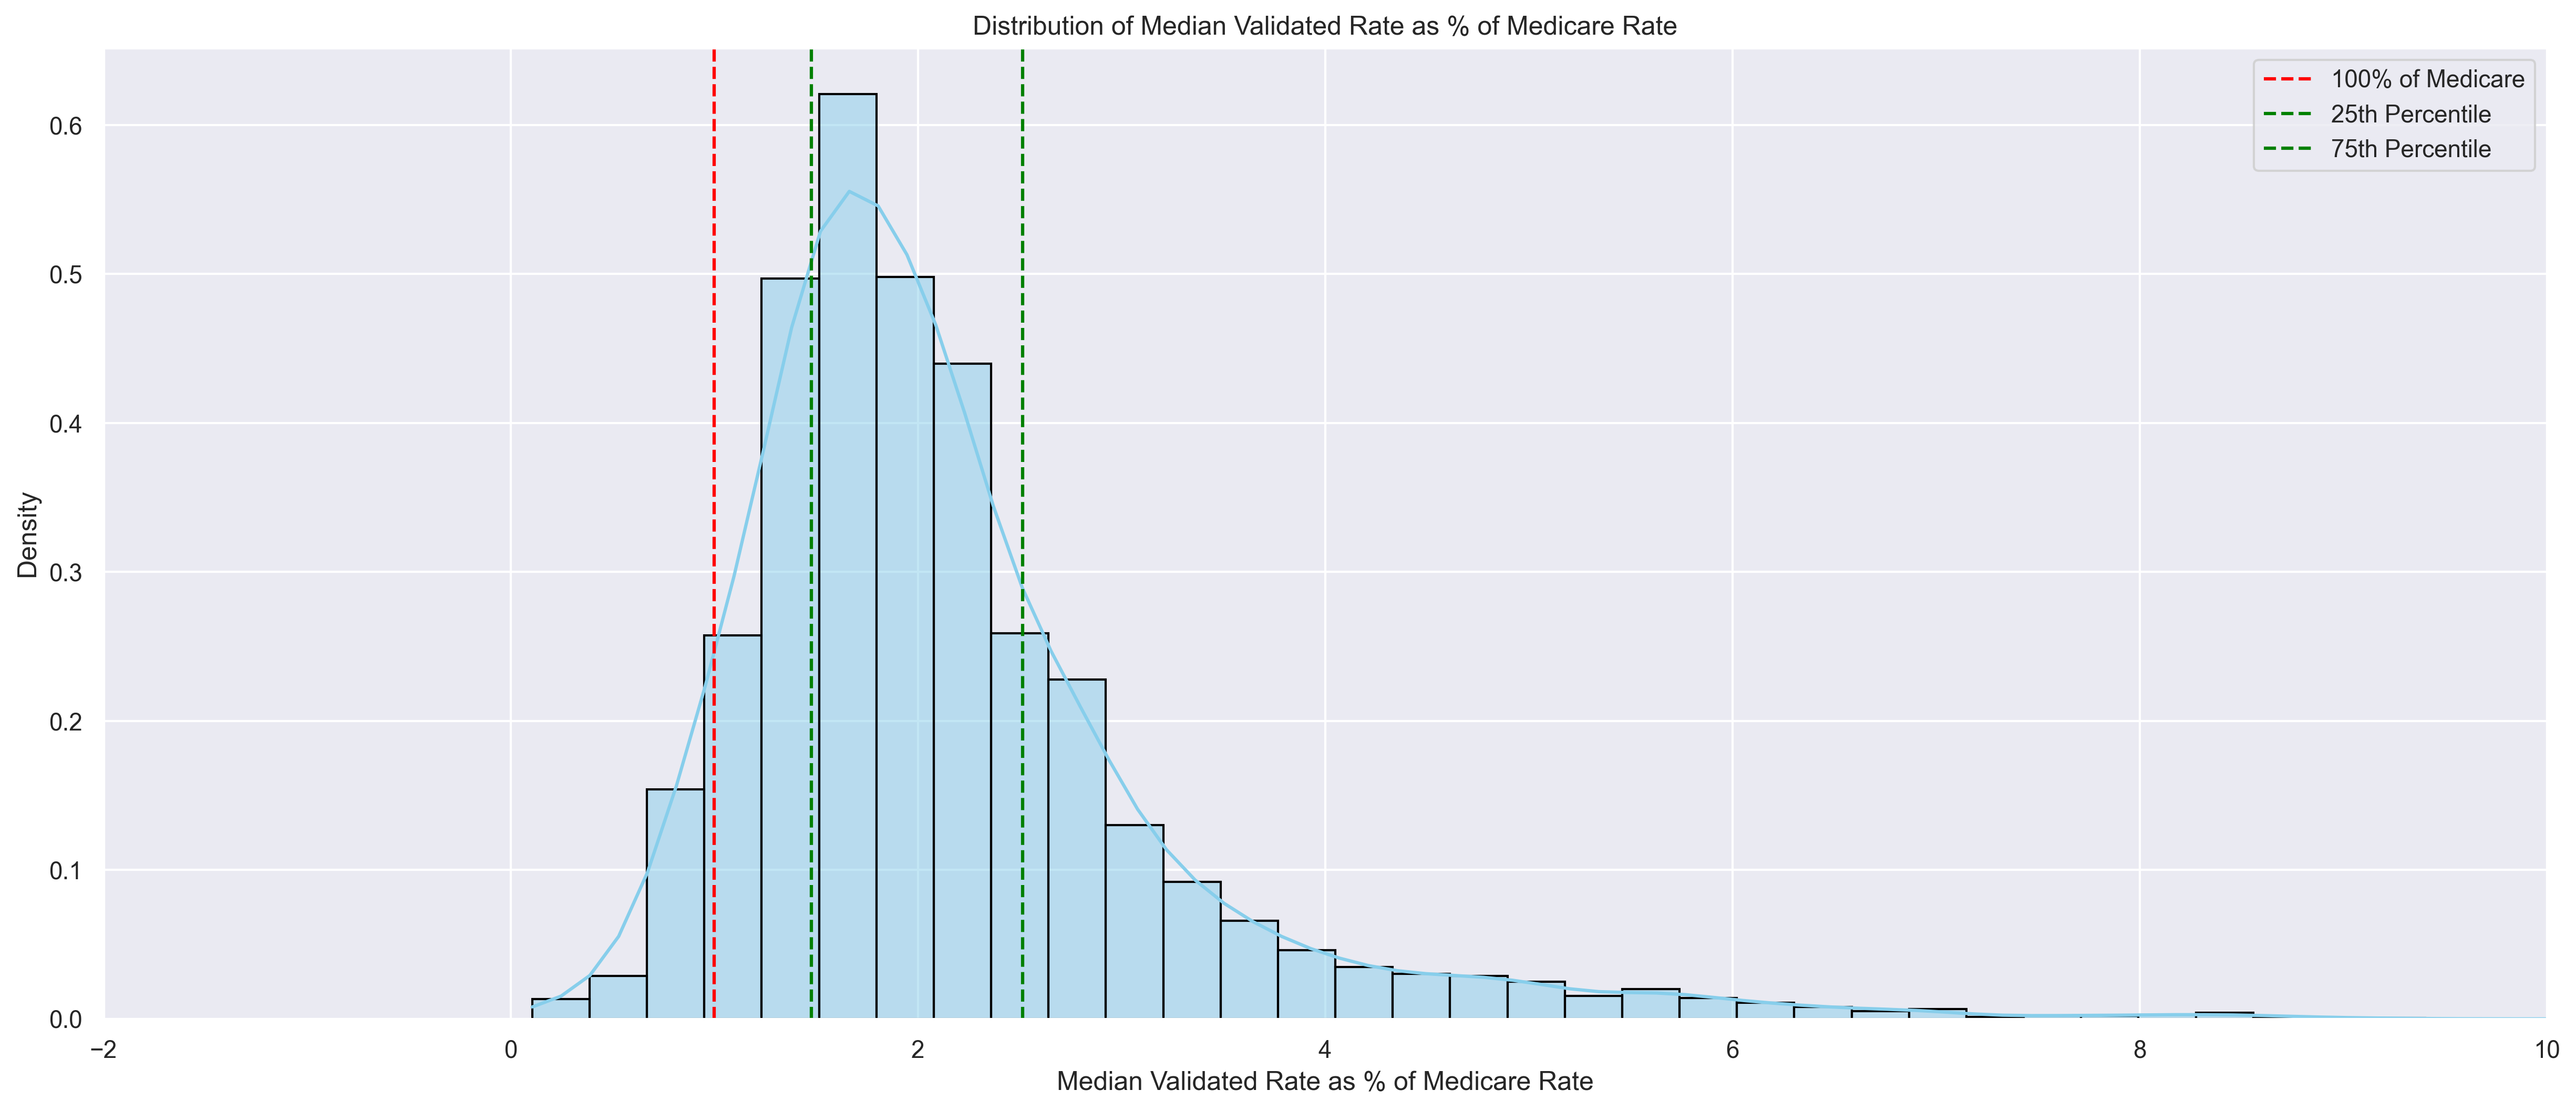
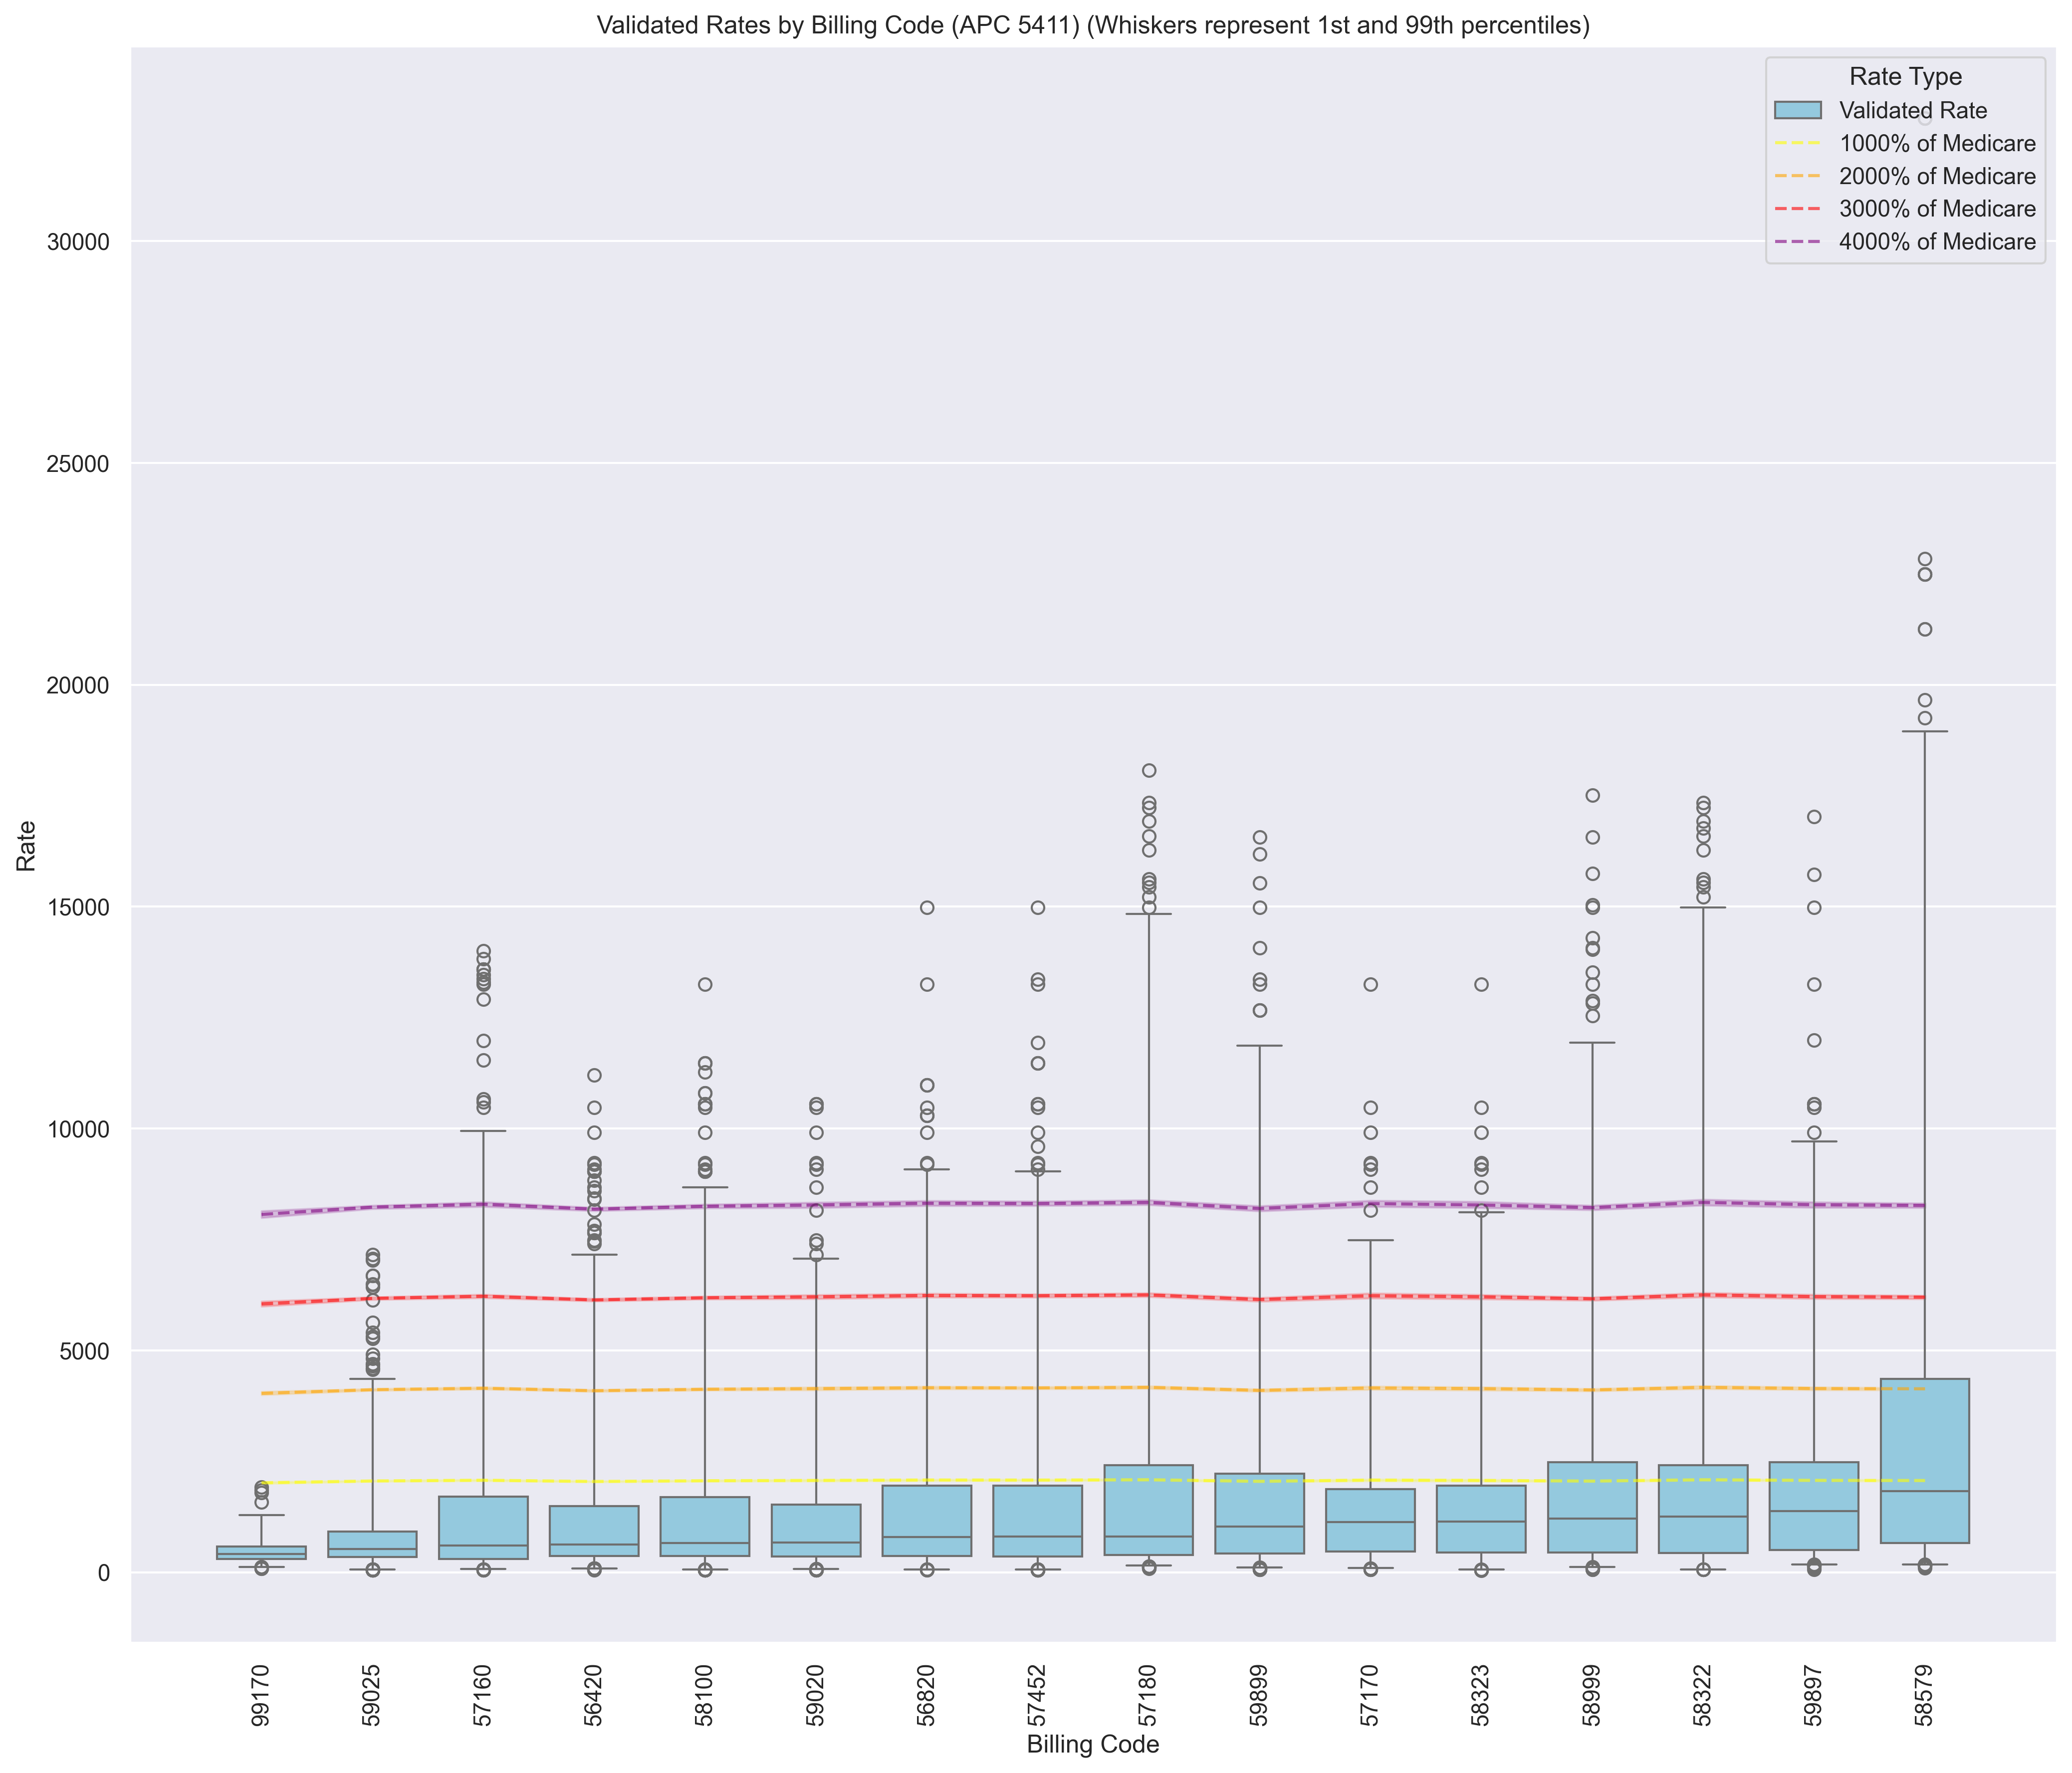
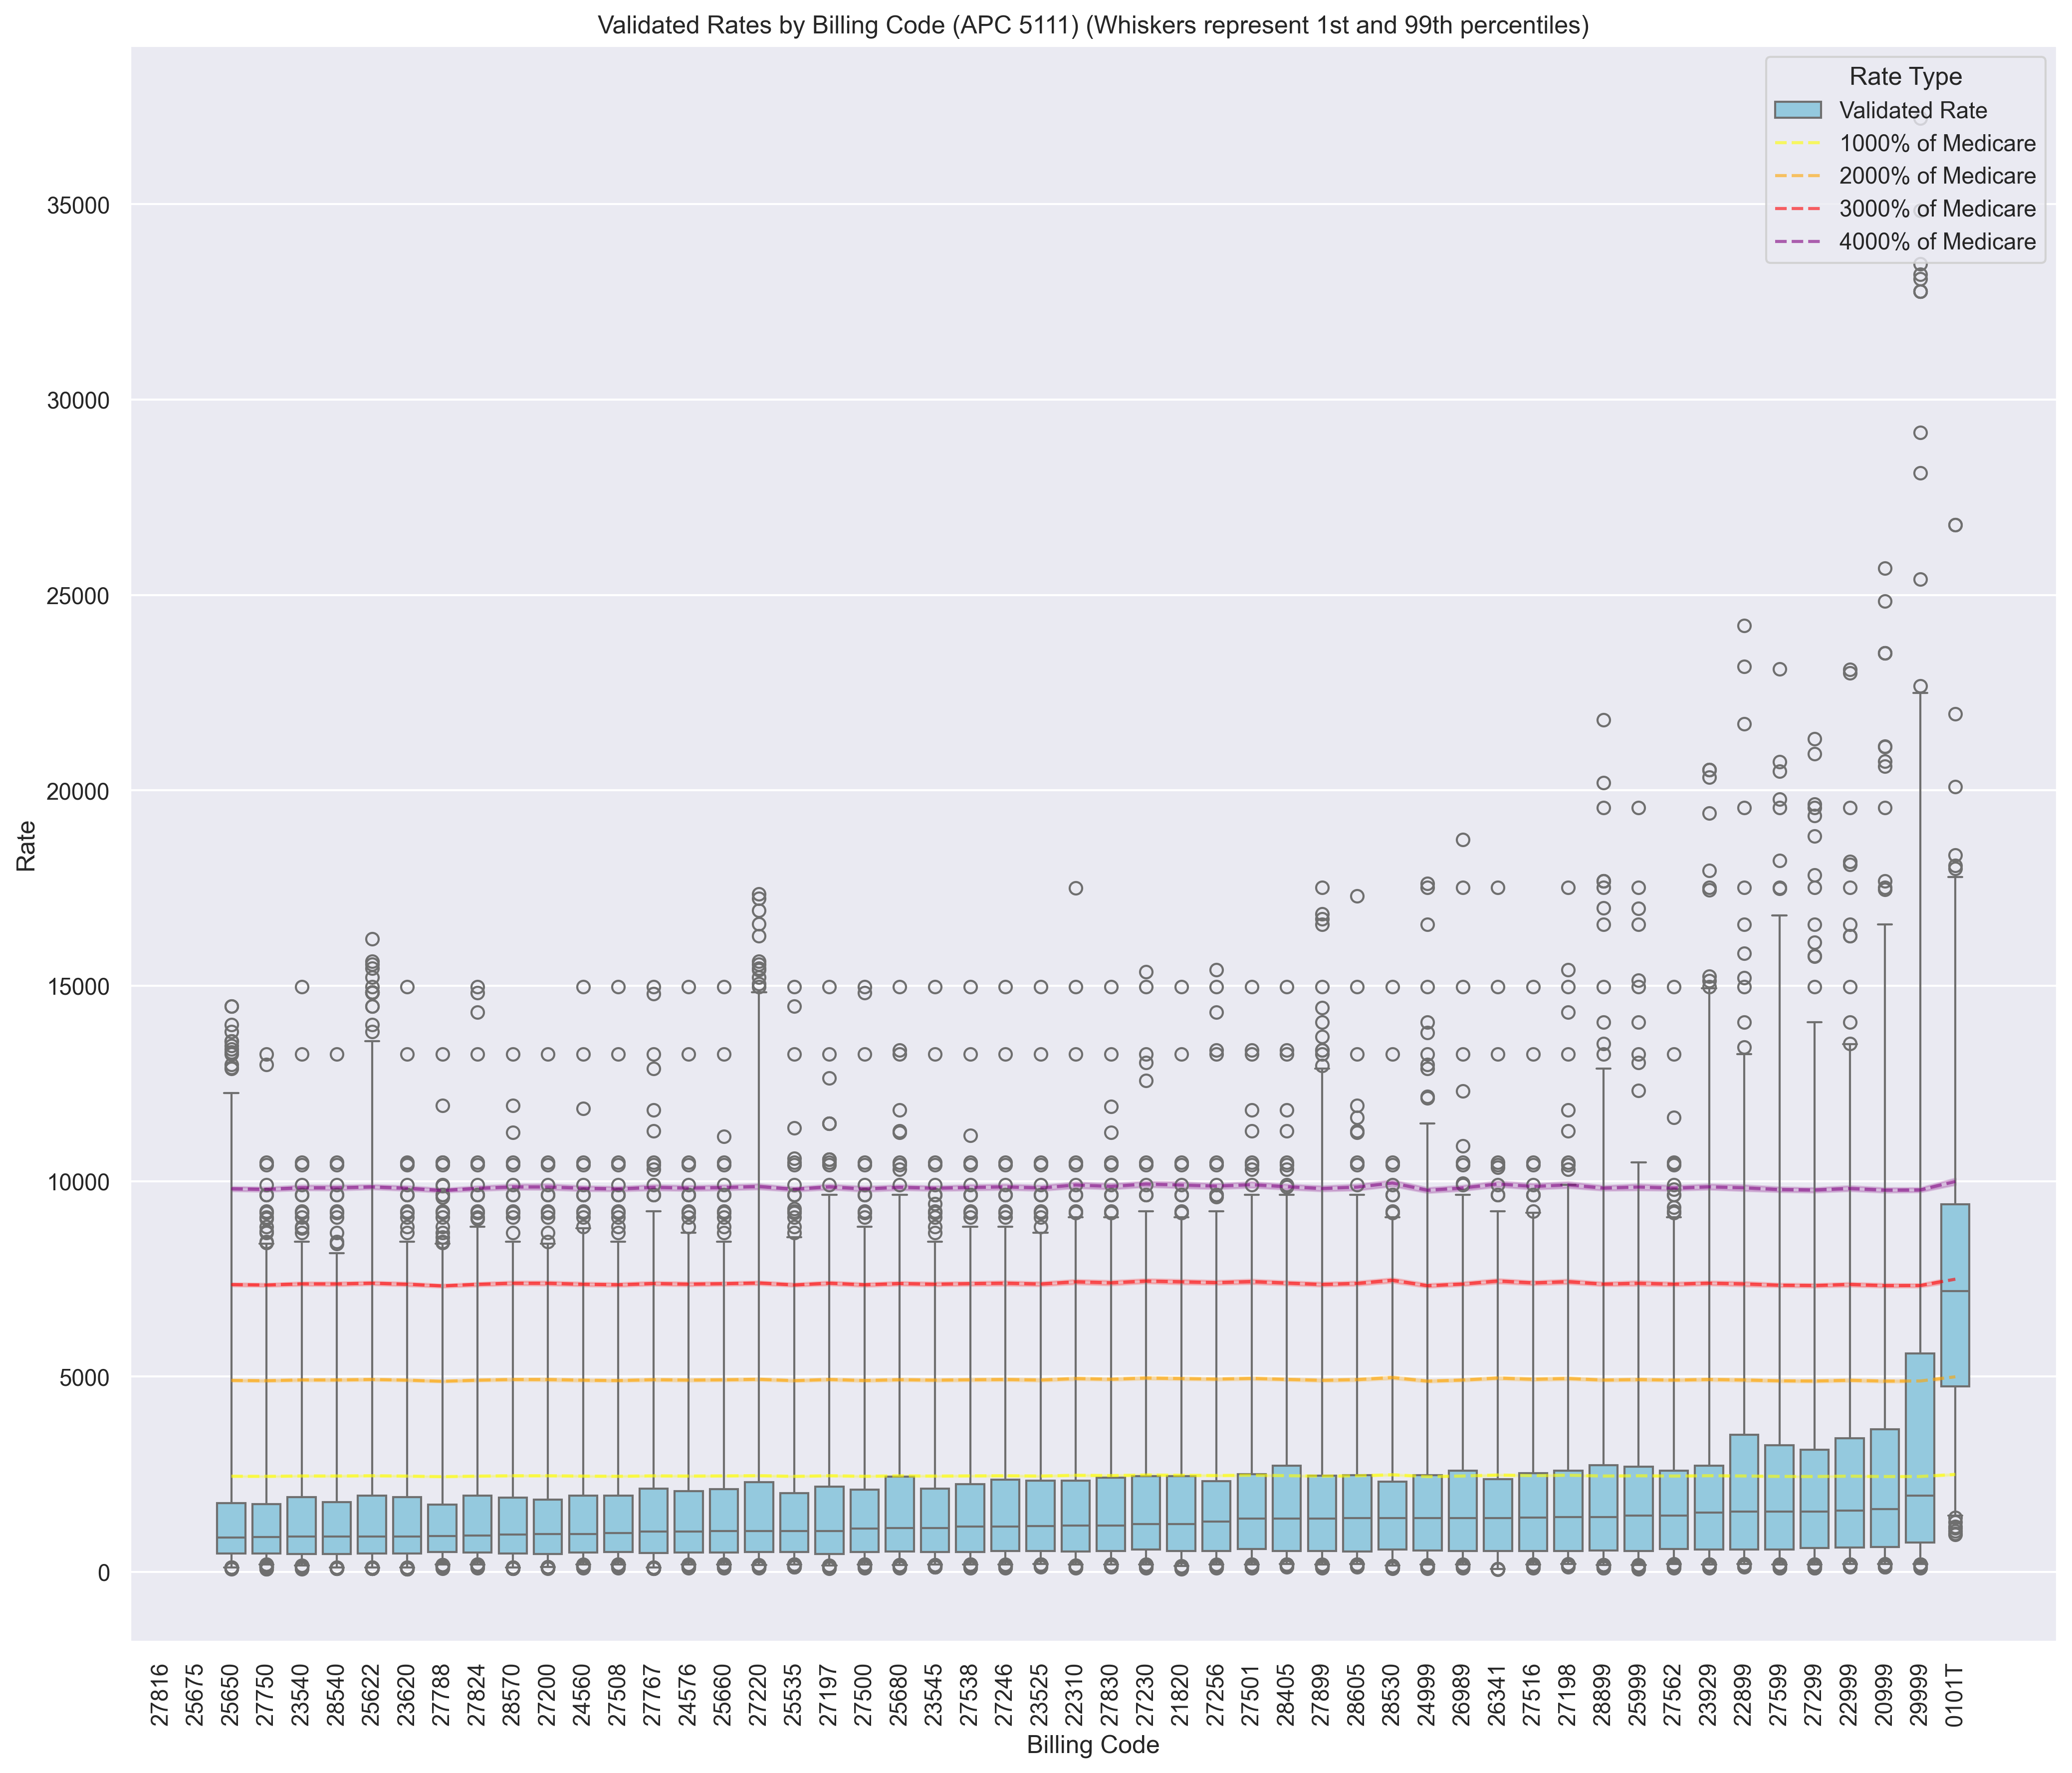
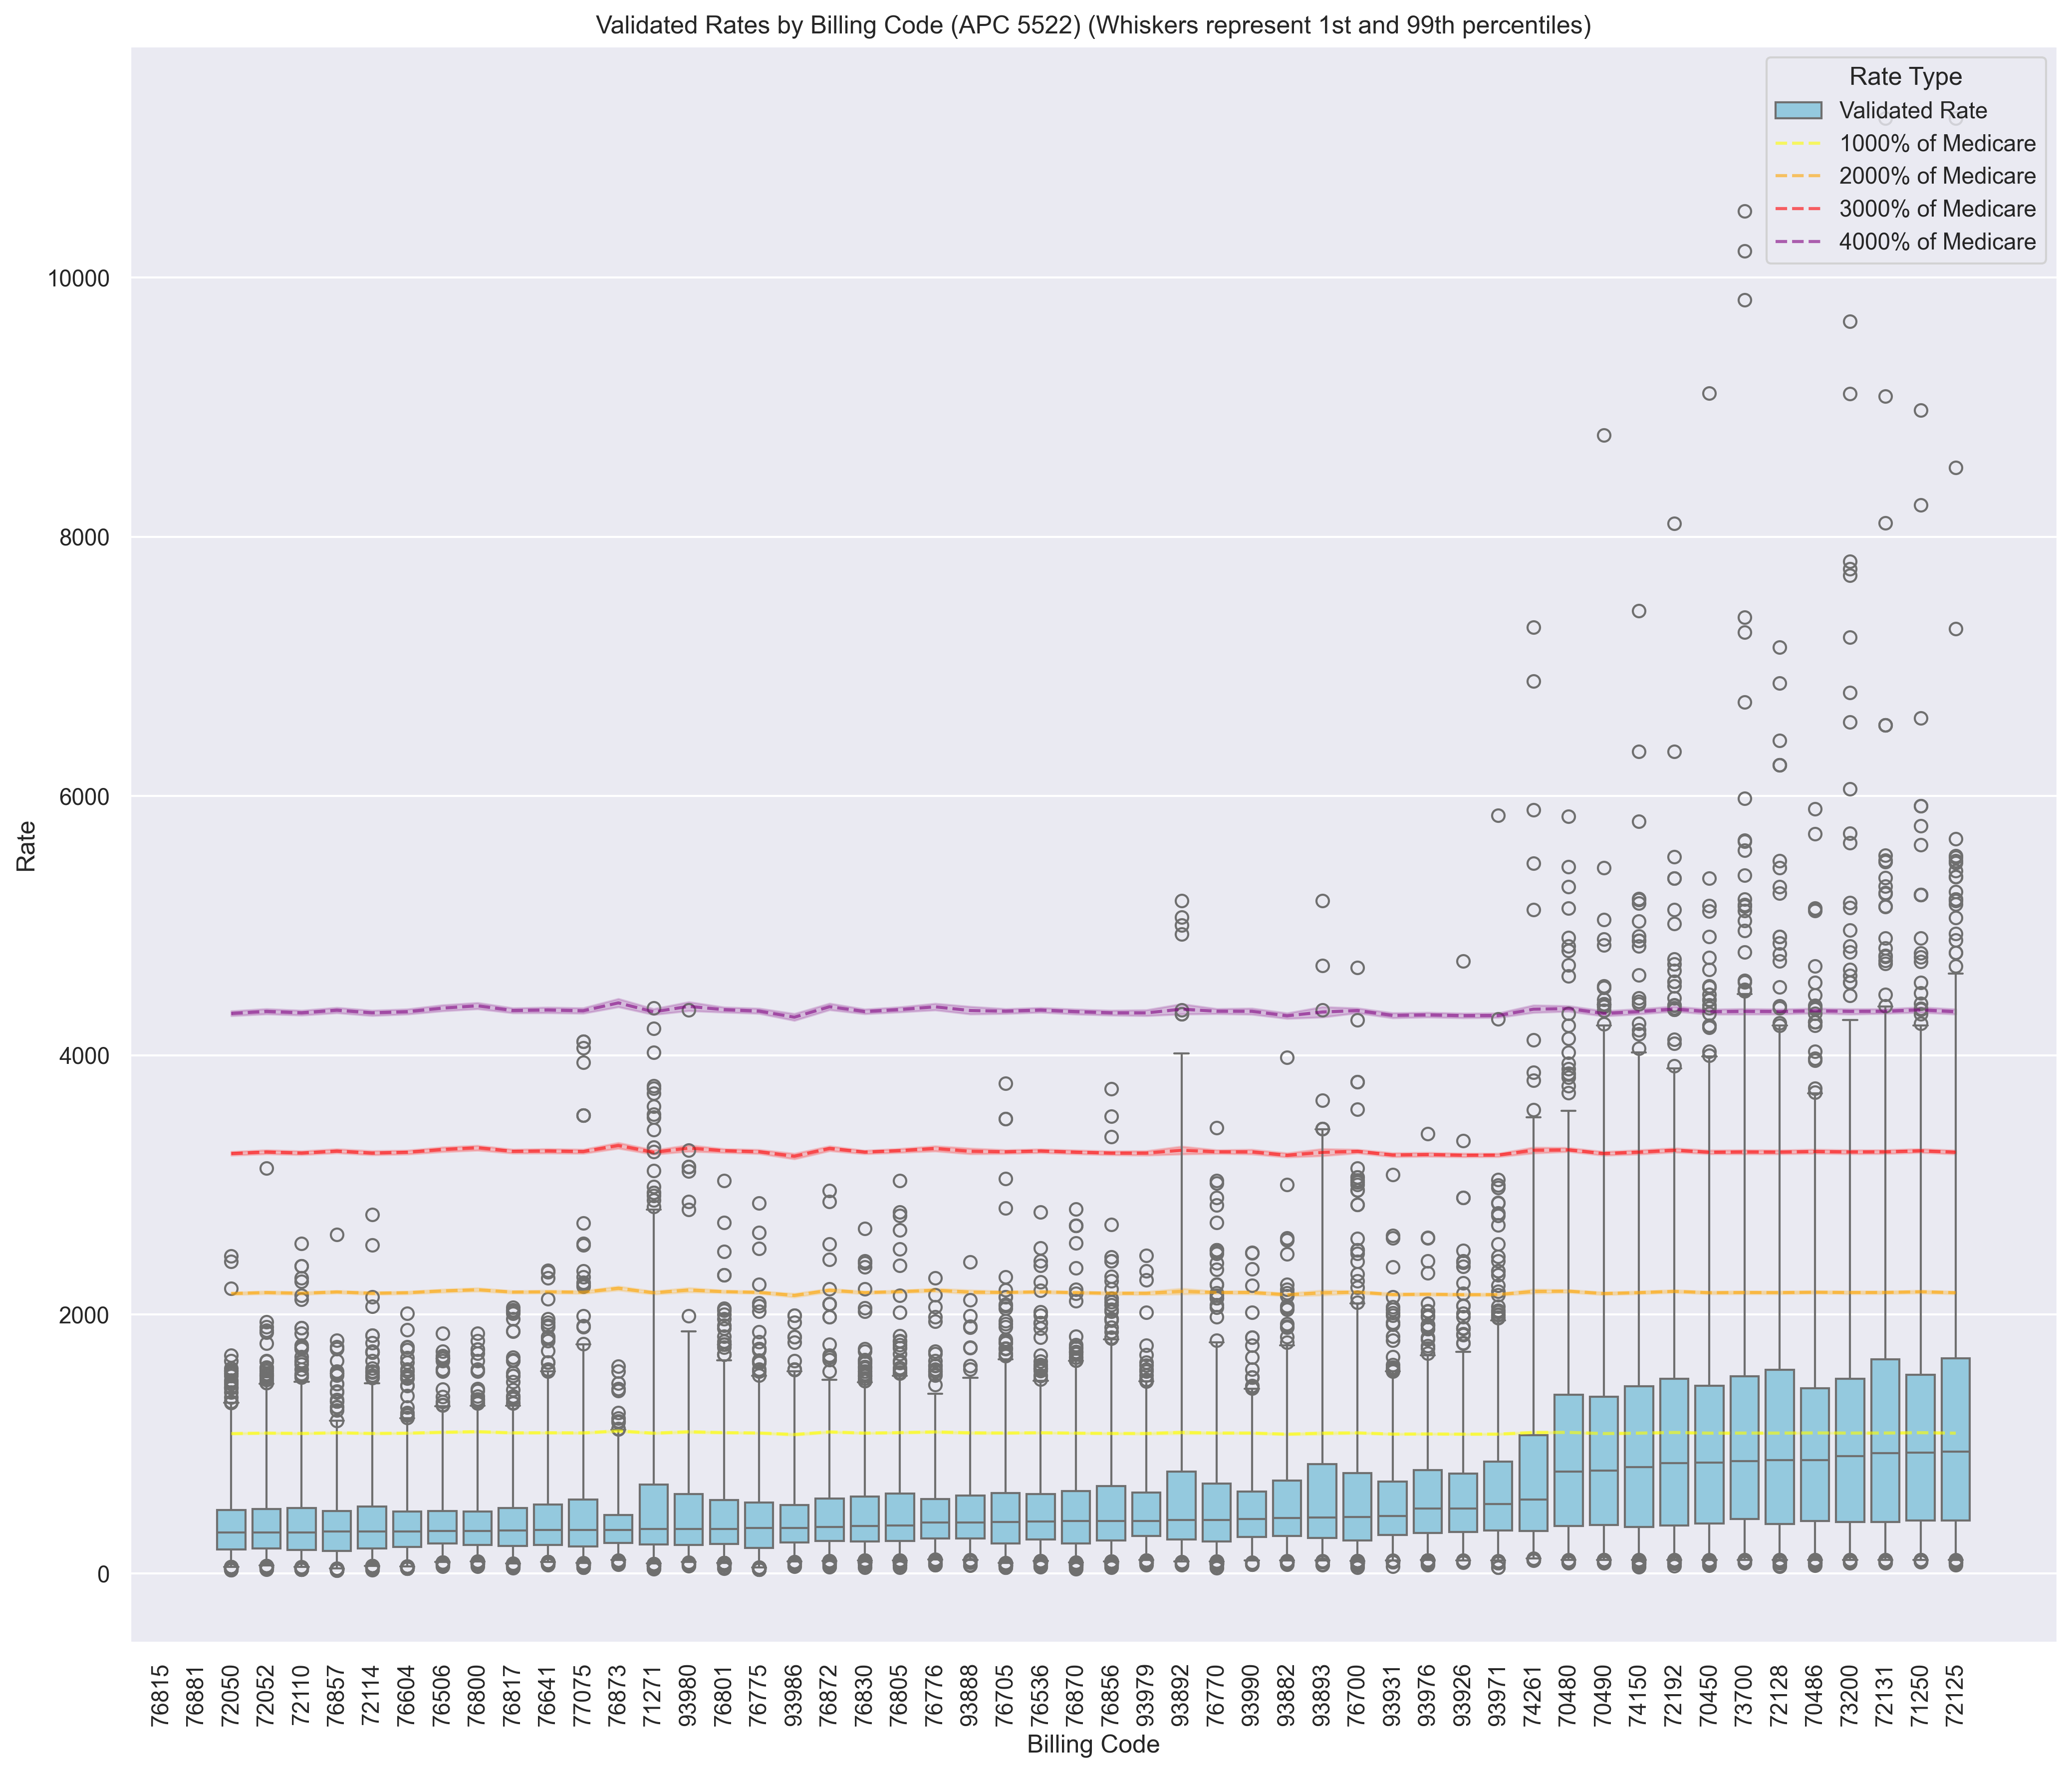
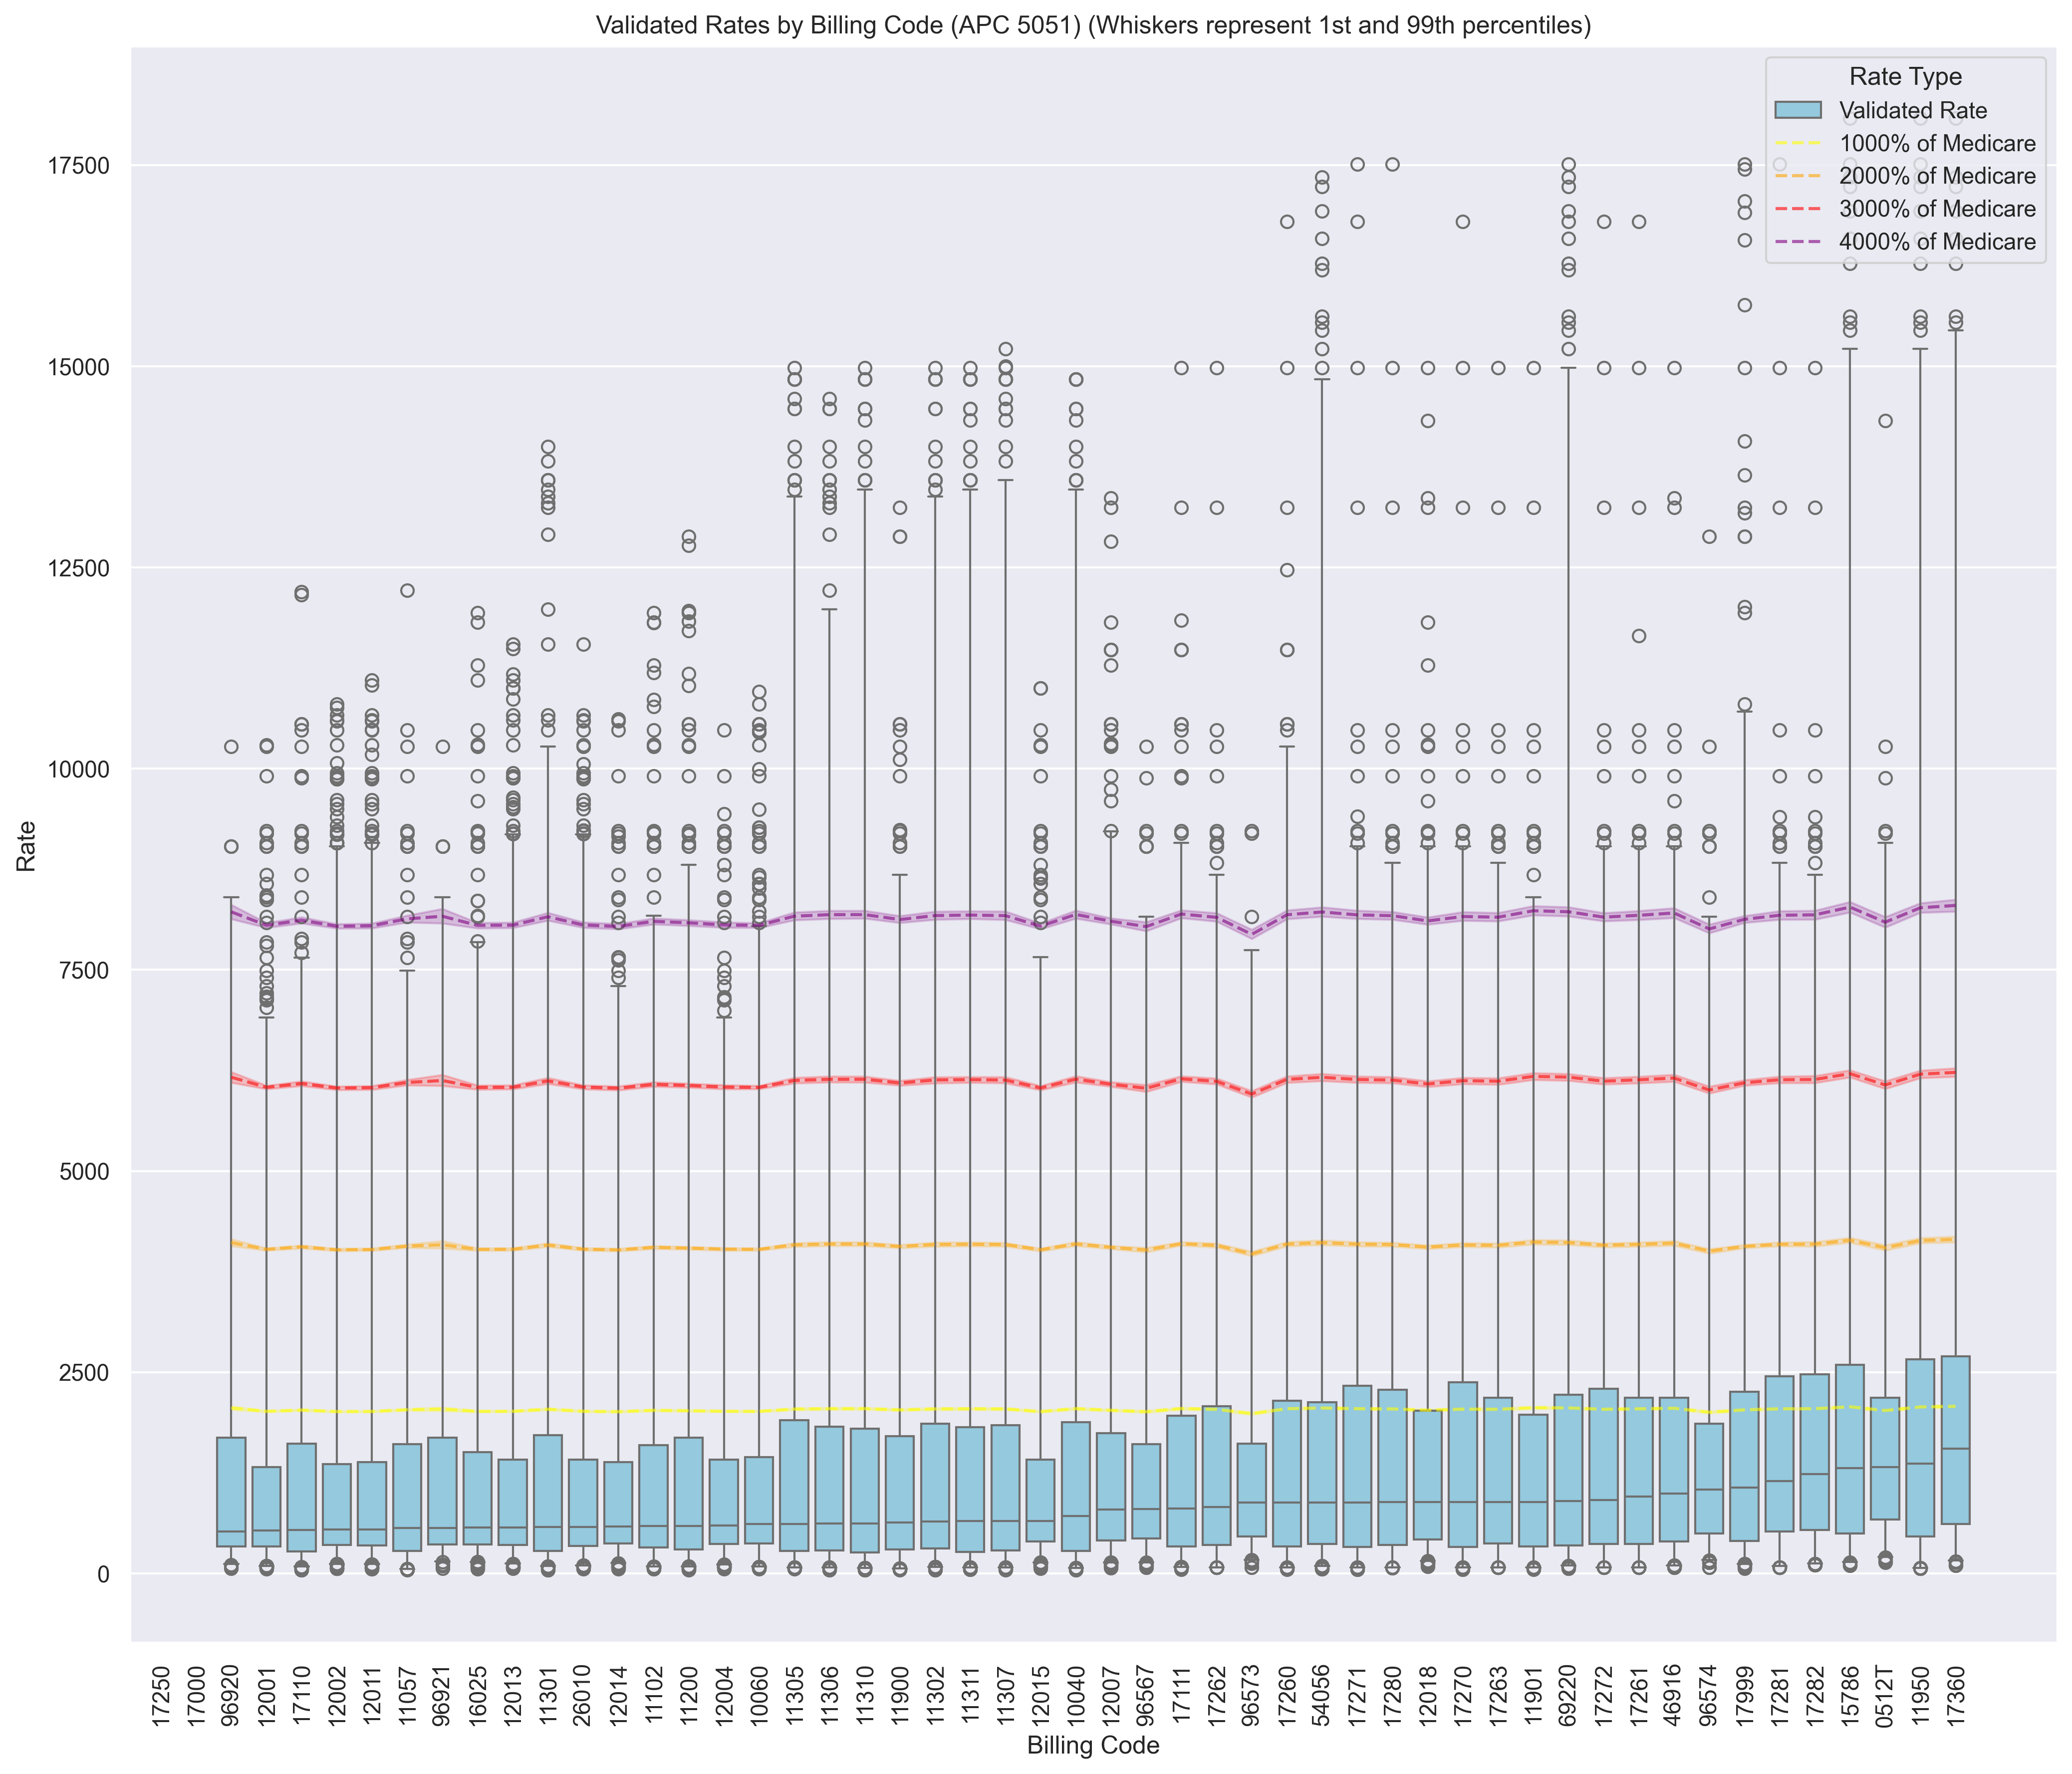
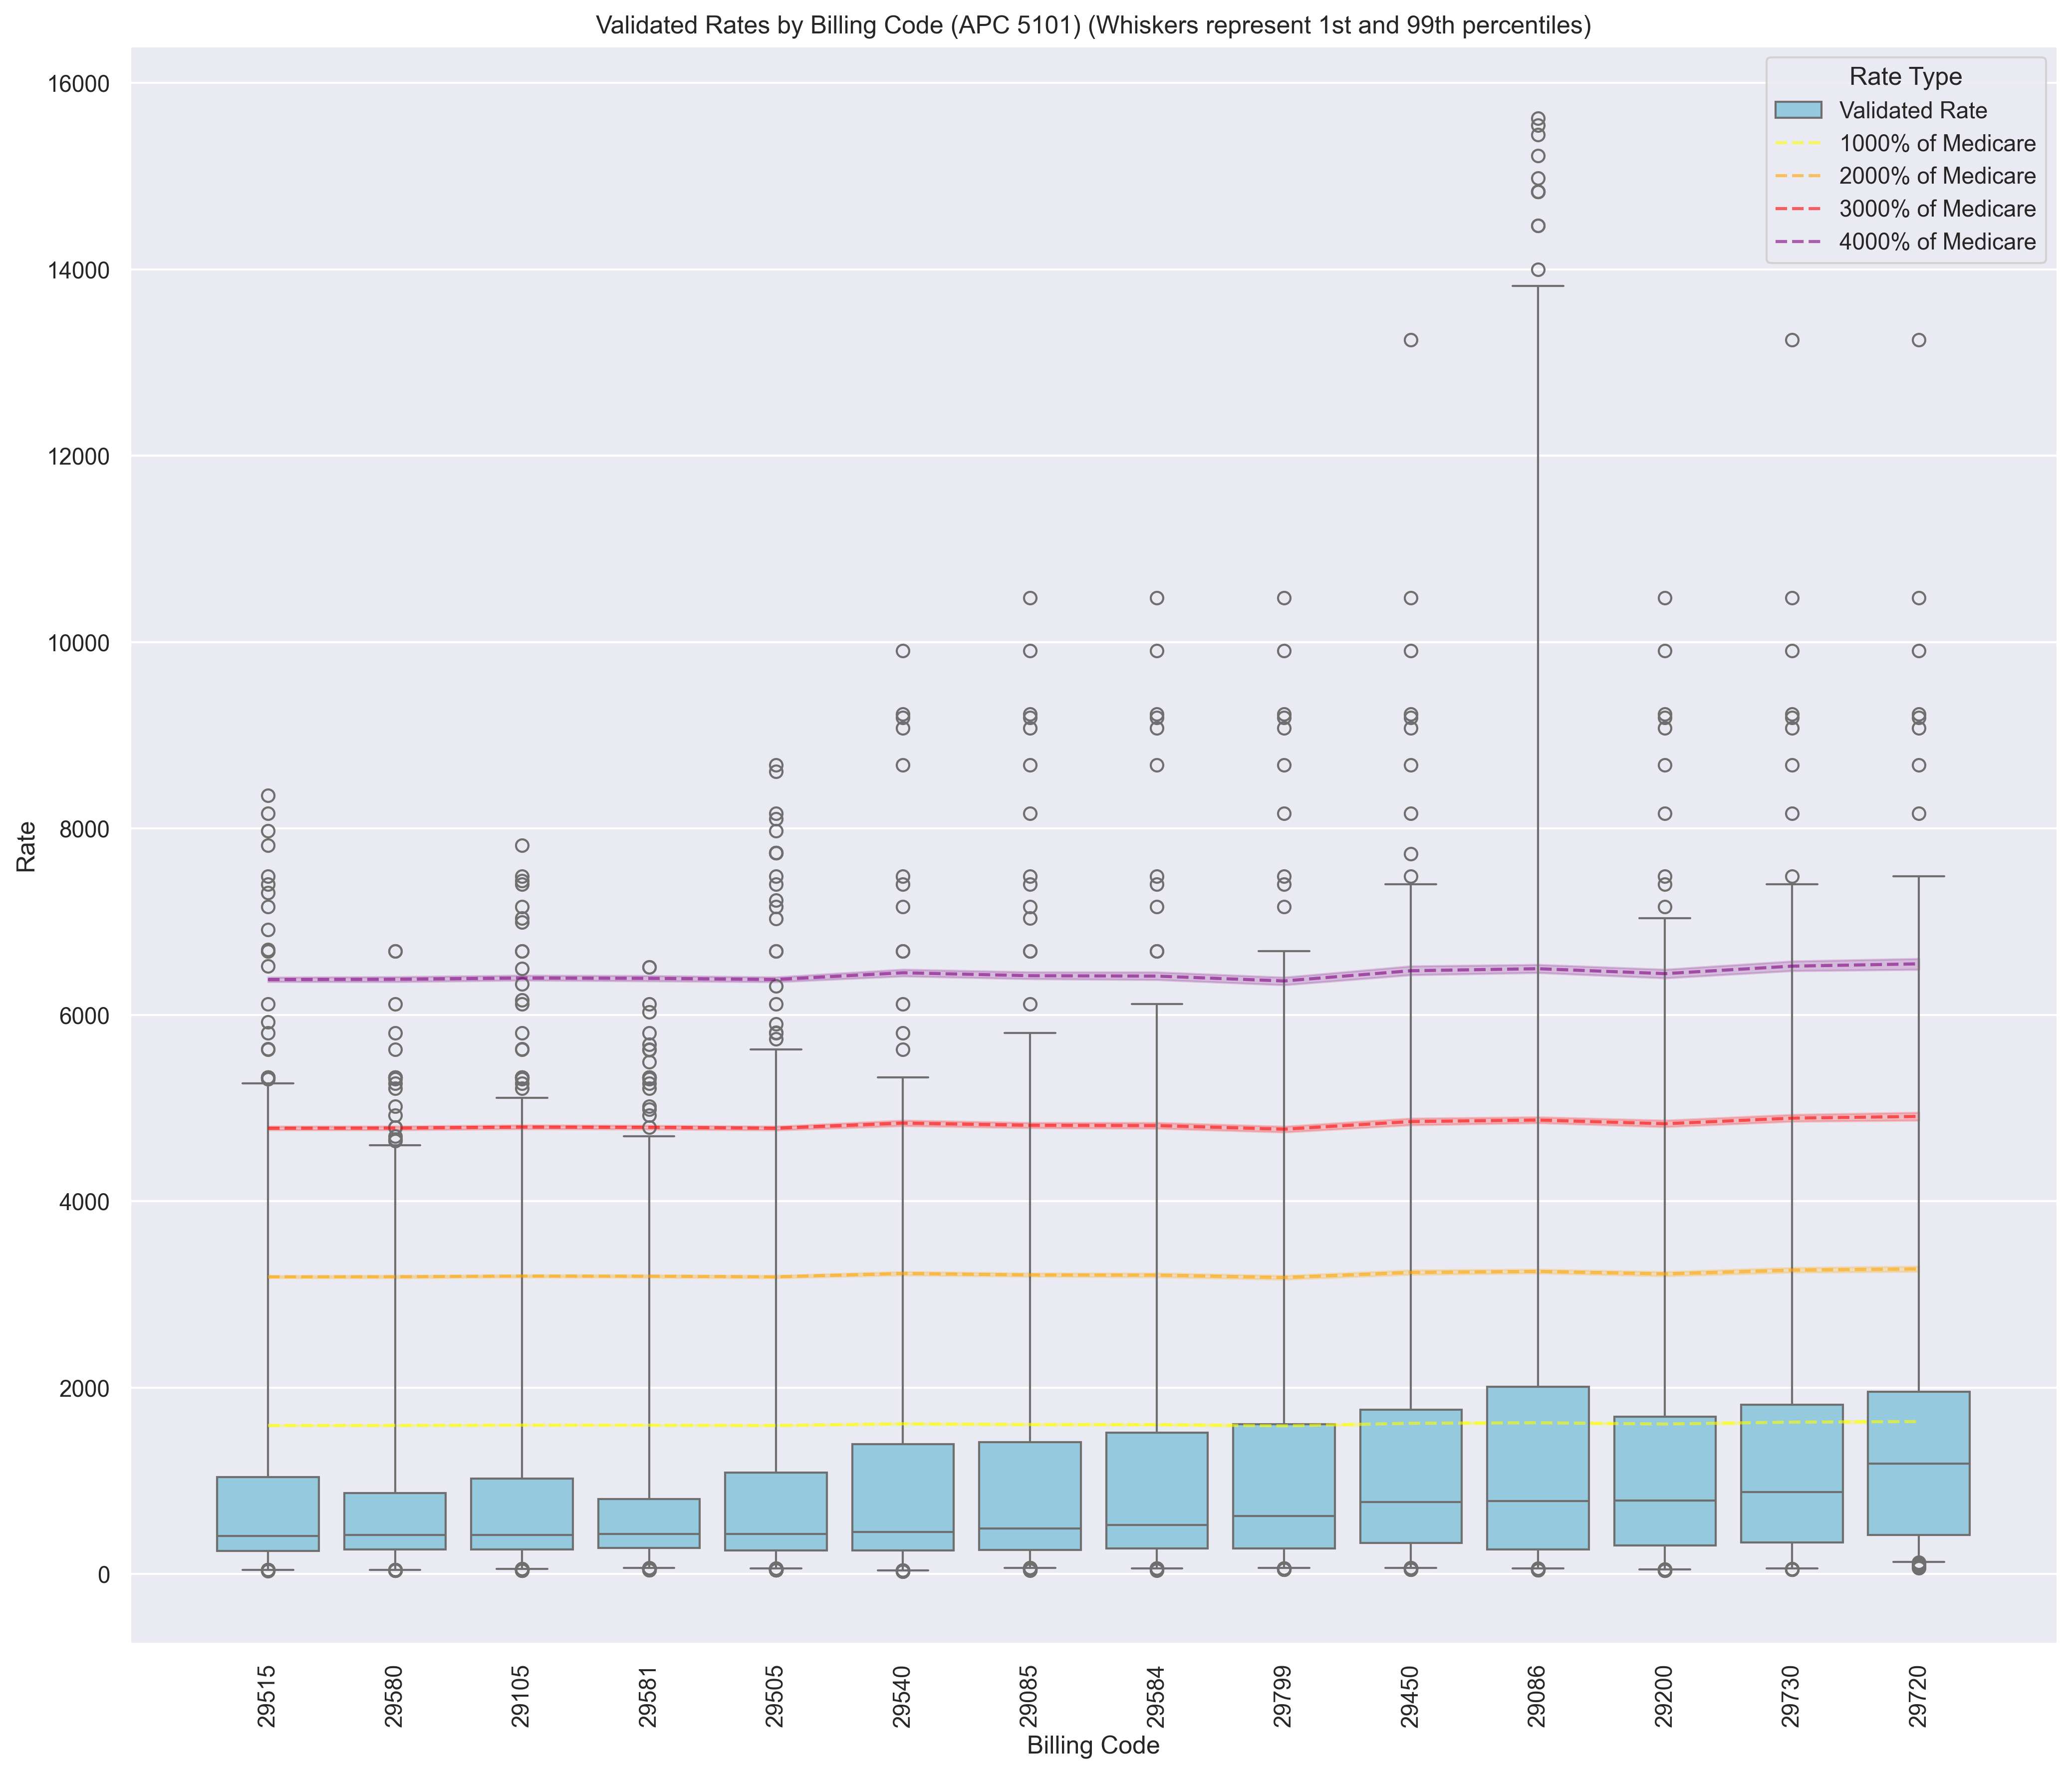
In contrast, variance is much wider for OPPS: the plot below shows the distribution of HCPCS median validated-rates as a % of medicare.
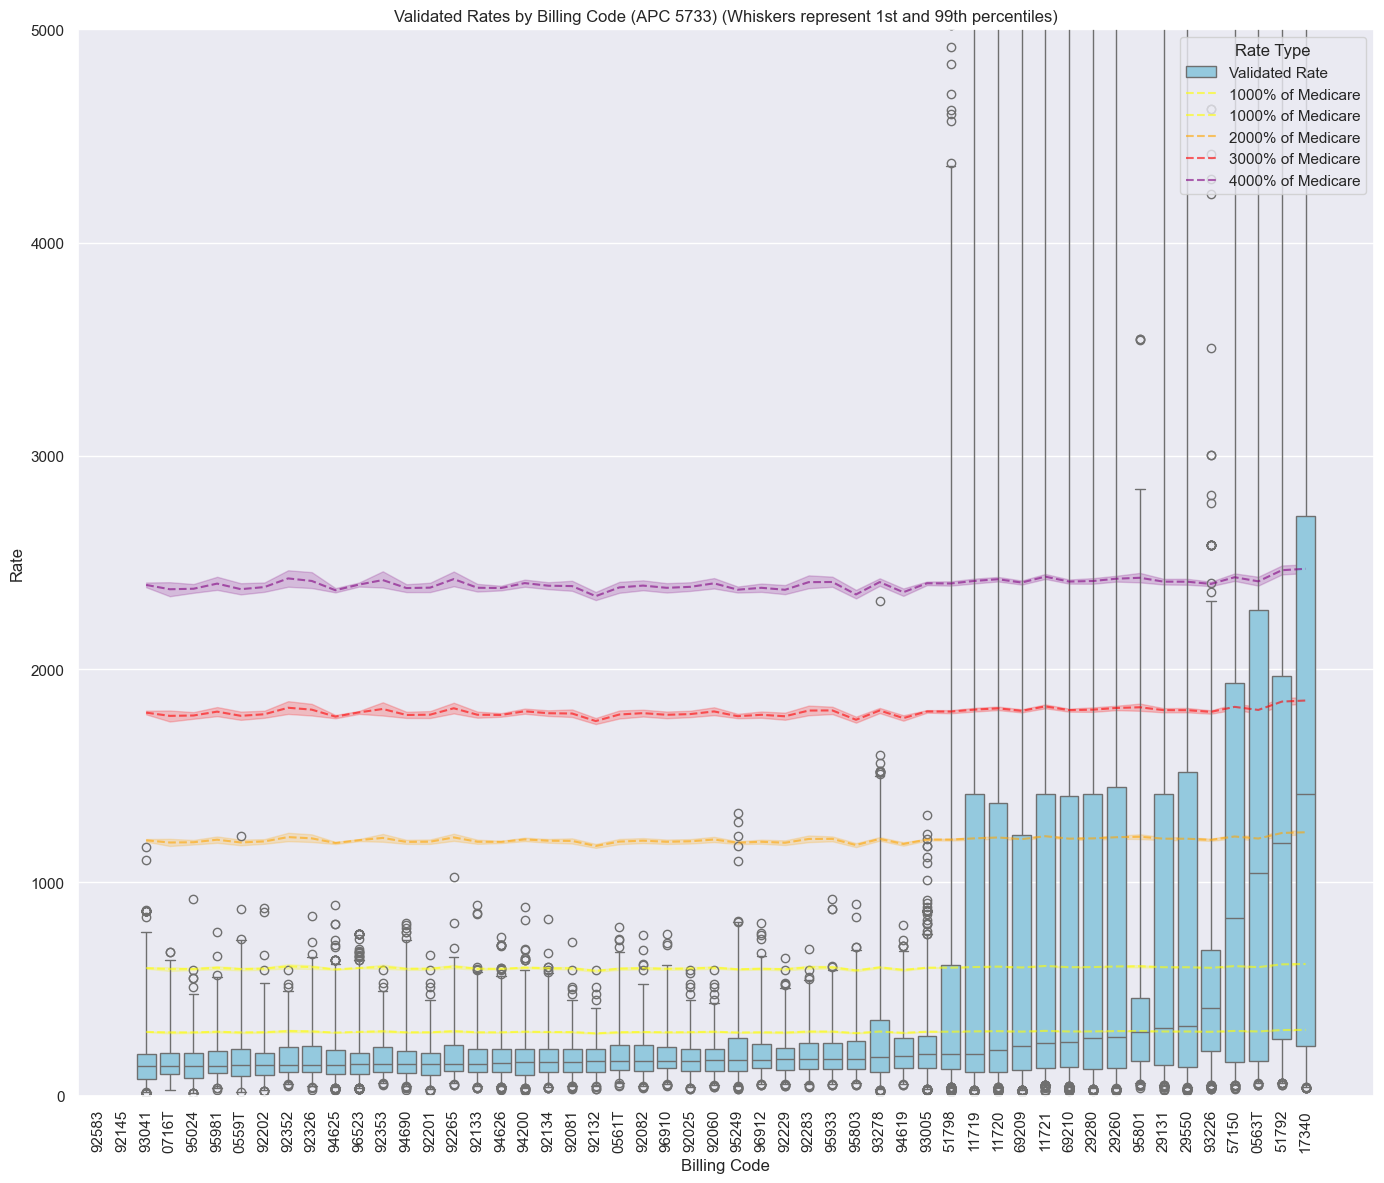
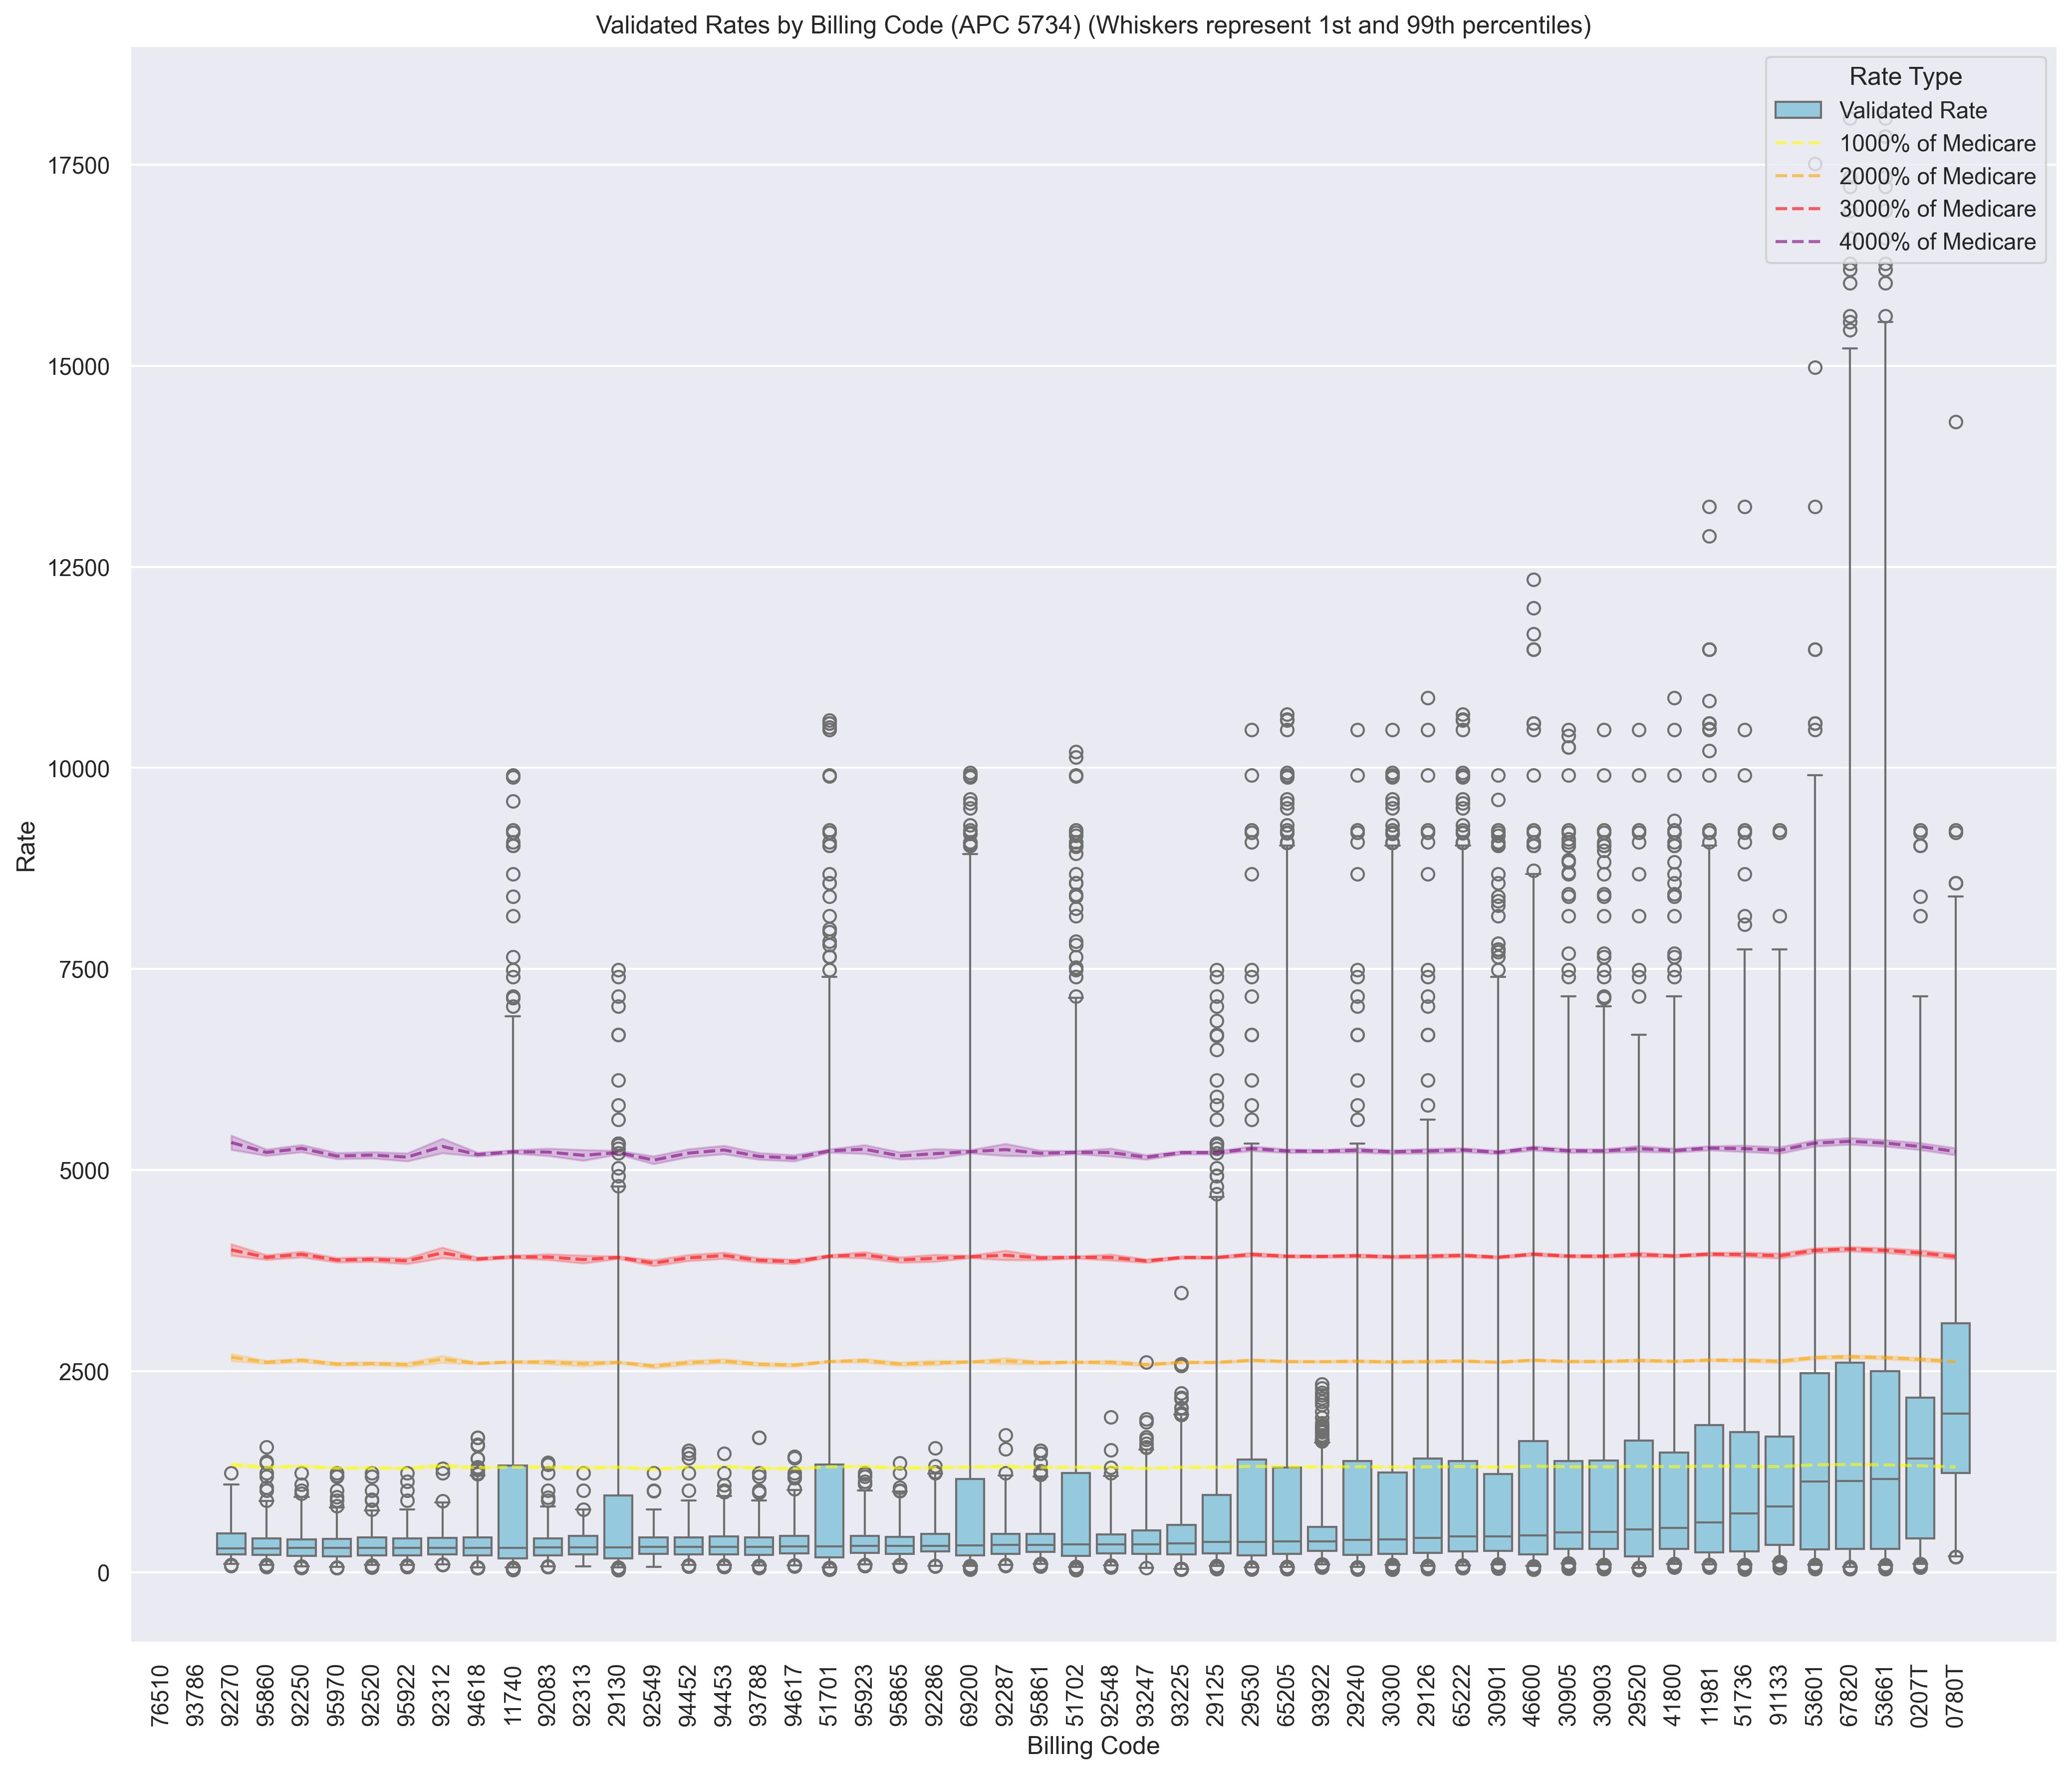
Here's an example of APC 5733. Majority of codes have medians < 500% of medicare, but ~a quarter have medians near 1000% of medicare or even above 2000% of medicare
Outliers
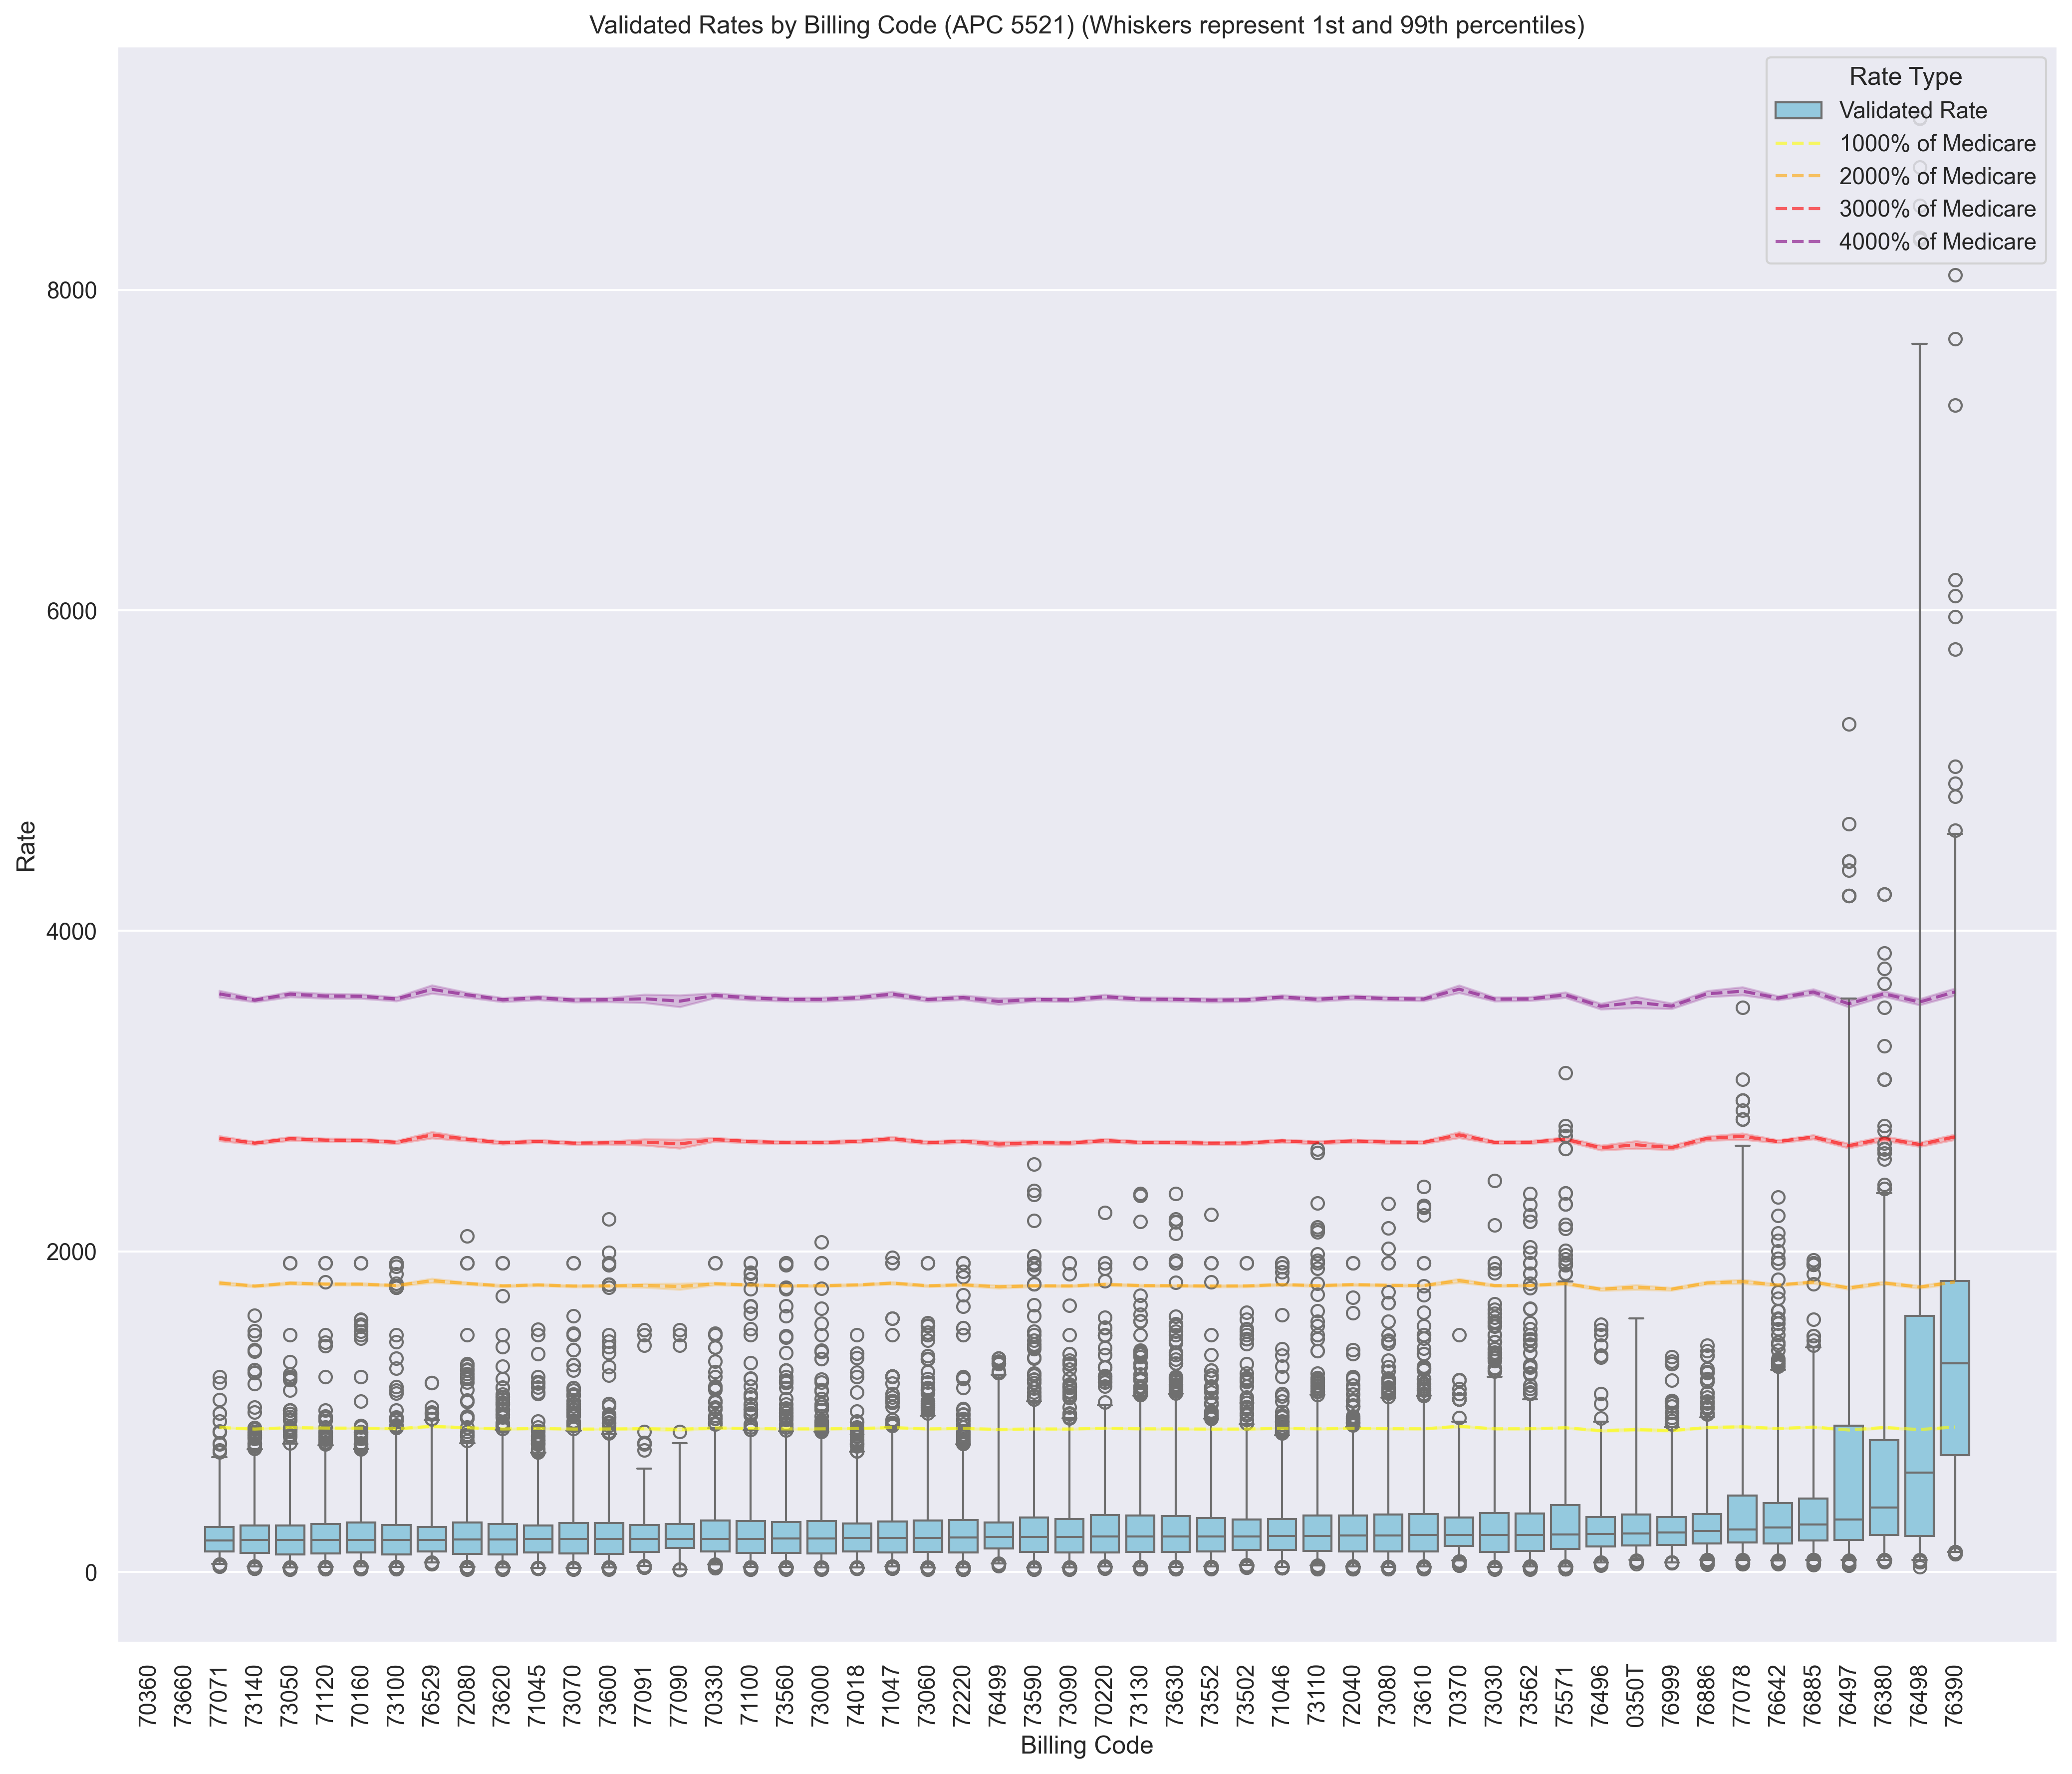
In the OP setting, we should be careful with using % of medicare to flag outliers. For some codes, we may see more than a quarter of validated rates > 3000% of medicare.
Instead, an approach that relies on the distribution of validated rates would be a better approach (e.g. log-iqr).
Appendix
More Plots By APC
Top 40 Codes with Highest Median as % of Medicare
| code | description | median_canonical_rate | median_medicare_rate | %_of_medicare |
|---|---|---|---|---|
| 0101T | EXTRACORPOREAL SHOCK WAVE INVOLVING MUSCULOSKELETAL SYSTEM, NOT OTHERWISE SPECIFIED | 6787.07 | 239.934 | 28.2872 |
| 17340 | CRYOTHERAPY (CO2 SLUSH, LIQUID N2) FOR ACNE | 1423.27 | 59.454 | 23.939 |
| 51792 | STIMULUS EVOKED RESPONSE (EG, MEASUREMENT OF BULBOCAVERNOSUS REFLEX LATENCY TIME) | 1183.85 | 59.4495 | 19.9136 |
| 0563T | EVACUATION OF MEIBOMIAN GLANDS, USING HEAT DELIVERED THROUGH WEARABLE, OPEN-EYE EYELID TREATMENT DEVICES AND MANUAL GLAND EXPRESSION, BILATERAL | 1029.23 | 57.9122 | 17.7722 |
| 0780T | INSTILLATION OF FECAL MICROBIOTA SUSPENSION VIA RECTAL ENEMA INTO LOWER GASTROINTESTINAL TRACT | 1924.27 | 128.616 | 14.9614 |
| 76390 | MAGNETIC RESONANCE SPECTROSCOPY | 1267.23 | 87.9334 | 14.4112 |
| 57150 | IRRIGATION OF VAGINA AND/OR APPLICATION OF MEDICAMENT FOR TREATMENT OF BACTERIAL, PARASITIC, OR FUNGOID DISEASE | 844.157 | 59.2329 | 14.2515 |
| 0207T | EVACUATION OF MEIBOMIAN GLANDS, AUTOMATED, USING HEAT AND INTERMITTENT PRESSURE, UNILATERAL | 1400.16 | 128.424 | 10.9026 |
| 58579 | UNLISTED HYSTEROSCOPY PROCEDURE, UTERUS | 1865.19 | 201.458 | 9.25847 |
| 72125 | COMPUTED TOMOGRAPHY, CERVICAL SPINE; WITHOUT CONTRAST MATERIAL | 948.138 | 106.279 | 8.92123 |
| 53661 | DILATION OF FEMALE URETHRA INCLUDING SUPPOSITORY AND/OR INSTILLATION; SUBSEQUENT | 1135.57 | 128.759 | 8.81933 |
| 67820 | CORRECTION OF TRICHIASIS; EPILATION, BY FORCEPS ONLY | 1121.11 | 128.749 | 8.70776 |
| 71250 | COMPUTED TOMOGRAPHY, THORAX, DIAGNOSTIC; WITHOUT CONTRAST MATERIAL | 915.655 | 106.267 | 8.61655 |
| 53601 | DILATION OF URETHRAL STRICTURE BY PASSAGE OF SOUND OR URETHRAL DILATOR, MALE; SUBSEQUENT | 1106.71 | 128.965 | 8.58145 |
| 72131 | COMPUTED TOMOGRAPHY, LUMBAR SPINE; WITHOUT CONTRAST MATERIAL | 904.527 | 106.301 | 8.50913 |
| 72128 | COMPUTED TOMOGRAPHY, THORACIC SPINE; WITHOUT CONTRAST MATERIAL | 887.13 | 106.203 | 8.35315 |
| 29999 | UNLISTED PROCEDURE, ARTHROSCOPY | 2000.73 | 239.54 | 8.35241 |
| 70450 | COMPUTED TOMOGRAPHY, HEAD OR BRAIN; WITHOUT CONTRAST MATERIAL | 872.114 | 106.292 | 8.20493 |
| 73700 | COMPUTED TOMOGRAPHY, LOWER EXTREMITY; WITHOUT CONTRAST MATERIAL | 869.824 | 106.262 | 8.18567 |
| 70486 | COMPUTED TOMOGRAPHY, MAXILLOFACIAL AREA; WITHOUT CONTRAST MATERIAL | 869.587 | 106.237 | 8.18532 |
| 72192 | COMPUTED TOMOGRAPHY, PELVIS; WITHOUT CONTRAST MATERIAL | 857.352 | 106.335 | 8.06273 |
| 73200 | COMPUTED TOMOGRAPHY, UPPER EXTREMITY; WITHOUT CONTRAST MATERIAL | 854.759 | 106.261 | 8.04396 |
| 31899 | UNLISTED PROCEDURE, TRACHEA, BRONCHI | 1531.87 | 192.772 | 7.94657 |
| 70480 | COMPUTED TOMOGRAPHY, ORBIT, SELLA, OR POSTERIOR FOSSA OR OUTER, MIDDLE, OR INNER EAR; WITHOUT CONTRAST MATERIAL | 828.809 | 106.243 | 7.8011 |
| 17360 | CHEMICAL EXFOLIATION FOR ACNE (EG, ACNE PASTE, ACID) | 1549.8 | 198.917 | 7.79119 |
| 74150 | COMPUTED TOMOGRAPHY, ABDOMEN; WITHOUT CONTRAST MATERIAL | 812.637 | 106.11 | 7.65843 |
| 70490 | COMPUTED TOMOGRAPHY, SOFT TISSUE NECK; WITHOUT CONTRAST MATERIAL | 804.321 | 106.001 | 7.58786 |
| 29720 | REPAIR OF SPICA, BODY CAST OR JACKET | 1171.94 | 158.081 | 7.41357 |
| 40899 | UNLISTED PROCEDURE, VESTIBULE OF MOUTH | 1695.7 | 230.435 | 7.35867 |
| 71275 | COMPUTED TOMOGRAPHIC ANGIOGRAPHY, CHEST (NONCORONARY), WITH CONTRAST MATERIAL(S), INCLUDING NONCONTRAST IMAGES, IF PERFORMED, AND IMAGE POSTPROCESSING | 1301.82 | 177.82 | 7.32099 |
| 70496 | COMPUTED TOMOGRAPHIC ANGIOGRAPHY, HEAD, WITH CONTRAST MATERIAL(S), INCLUDING NONCONTRAST IMAGES, IF PERFORMED, AND IMAGE POSTPROCESSING | 1261.85 | 177.917 | 7.09235 |
| 93226 | EXTERNAL ELECTROCARDIOGRAPHIC RECORDING UP TO 48 HOURS BY CONTINUOUS RHYTHM RECORDING AND STORAGE; SCANNING ANALYSIS WITH REPORT | 414.288 | 58.7557 | 7.05103 |
| 76498 | UNLISTED MAGNETIC RESONANCE PROCEDURE (EG, DIAGNOSTIC, INTERVENTIONAL) | 614.584 | 87.431 | 7.02936 |
| 67208 | DESTRUCTION OF LOCALIZED LESION OF RETINA (EG, MACULAR EDEMA, TUMORS), 1 OR MORE SESSIONS; CRYOTHERAPY, DIATHERMY | 2088.03 | 299.342 | 6.97539 |
| 67516 | SUPRACHOROIDAL SPACE INJECTION OF PHARMACOLOGIC AGENT (SEPARATE PROCEDURE) | 2303.71 | 330.345 | 6.97364 |
| 70498 | COMPUTED TOMOGRAPHIC ANGIOGRAPHY, NECK, WITH CONTRAST MATERIAL(S), INCLUDING NONCONTRAST IMAGES, IF PERFORMED, AND IMAGE POSTPROCESSING | 1238.8 | 177.964 | 6.96098 |
| 20999 | UNLISTED PROCEDURE, MUSCULOSKELETAL SYSTEM, GENERAL | 1656.69 | 238.681 | 6.941 |
| 69979 | UNLISTED PROCEDURE, TEMPORAL BONE, MIDDLE FOSSA APPROACH | 1613.37 | 232.527 | 6.93841 |
| 20561 | NEEDLE INSERTION(S) WITHOUT INJECTION(S); 3 OR MORE MUSCLES | 168.951 | 24.4465 | 6.91106 |
| 21085 | IMPRESSION AND CUSTOM PREPARATION; ORAL SURGICAL SPLINT | 1602.48 | 232.527 | 6.89158 |
Bias Example
How can this introduce bias when we calculate aggregate statistics?
Complete Overlap
When we have complete overlap, the relative comparisons between hospitals is still meaningful, even if the magnitude is not.
In the example below, code 72125 has a commercial median that is well above medicare (900%), whereas the other codes do not. Nevertheless, we correctly conclude that hospital Y's rates are higher than hospital Y on average.
However, it could be misleading to say hospital X's rates are on average 400% of medicare. This is true - but it's driven solely by code 72125.
| code | median % of medicare | hospital X | hospital Y |
|---|---|---|---|
| 72125 | 892.123% | 1000% | 1000% |
| 25066 | 175.5% | 200% | 300% |
| 53442 | 140.6% | 200% | 300% |
| 25071 | 253.6% | 200% | 300% |
| average | 365.456% | 400% | 475% |
Bias in Missingness
When we do not have complete overlap, there's potential for the relative comparisons between hospitals to be inaccurate.
In the example below, we have a rate for 72125 for hospital X, but not for hospital Y. We incorrectly conclude that hospital X has higher rates relative to medicare.
| code | median % of medicare | hospital X | hospital Y |
|---|---|---|---|
| 72125 | 892.123% | 1000% | NULL |
| 25066 | 175.5% | 200% | 300% |
| 53442 | 140.6% | 200% | 300% |
| 25071 | 253.6% | 200% | 300% |
| average | 365.456% | 400% | 300% |
How often do we expect this to happen? It depends on the randomness of missingness. If we are looking at 1000 codes, there may be codes like 72125 that have high median % of medicare, but hospital Y has a rate whereas hospital X does not. And so the effect of this bias would "even out".
Solutions (WIP)
- For Analyze:
- Evaluate bias in real reports by comparing against versions of reports that adjust for the OPPS-bias.
- We may not want to surface this to customers, but one strategy would be to
use national commercial medians as benchmarks. Log-transform to reduce skew
and compute inverse-variance weighted average % of medians. This would standardize
the various relative-to-benchmarks metrics.
- How often does this metric conflict with un-weighted un-adjusted Analyze reports' conclusions?
- Don't use % of medicare to flag outliers for OP codes (we use IQR on log-scale in CLD)